

|
WugLyfe posted:Yeah, that's my primary mover too. I went to R to make heatmaps for work, but tbh I'd like to get better/learn more from someone who doesn't just post a huge wall of text on a 1990s website. SAS does heatmaps really well, but I get that for all this ad-hoc in your free time kinda stuff the cost is prohibitive. Thus why I think everyone uses R. STATA is what I used back in college but I can barely remember how it even works these days.
|
 #
?
Sep 1, 2015 19:50
#
?
Sep 1, 2015 19:50
|
|

|

|
| # ? May 5, 2024 10:06 |
|
|
Forever_Peace posted:This thread is relevant to my interests and I may or may not write something in the coming weeks/months. I've done some stuff for the fantasy football thread but now that I have nfldb setup for python queries I might as well do actual football stuff too. Maybe I'll build a interface for this on a public-facing server sometime? E: I might try and port nflgame to Python 3 but  Actually, this guy seems to have ported nflgame to Python 3: https://github.com/playpauseandstop/nflgame Ghost of Reagan Past fucked around with this message at 20:01 on Sep 1, 2015 |
|
#
?
Sep 1, 2015 19:55
|
|

|
Alright, lets do some nerd poo poo. Since time immemorial, people have been pondering one of the deep mysteries of our universe: is Joe Flacco an elite quarterback??!?!!  Well clearly, the flaccostache is worthy of second-tier-elite NFL mustaches, alongside Andy Reid and Shahid Kahn (a ways behind tier-one Ben Davidson), but does the flaccostache endow the level of Eli-bullshit-magic that can push Flacco's quarterbacking skills over the edge? Let's find out!  Phfquaddafuckever, this is all bullshit anyways So here's how I went about this. First, I refined the question: "Has Joe Flacco performed at an elite level compared to other QBs over the past five years?. This time span includes his superbowl victory +/- 2 years, which should theoretically be peak Flacco. This is not a predictive question (e.g. projecting how we expect Flacco to perform in the future), this is purely a retrospective measurement question, which is easier. Then, I gathered the data. I decided completely arbitrarily that an elite quarterback should be good at the following things. Completing passes. One of the few metrics that's actually pretty stable not only from season to season, but even from college to the NFL. Can Flacco throw the damned ball to his guy? Success Rate. I wanted a metric that reflects how the QB performs relative to down and distance. SR% reflects whether the play could reasonably be considered to have met it's goals. Is Alex Smith elite because he can complete a 3-yard checkdown with a high probability on a 3rd and 8? No. No he is not. Expected Points Added per Play. I wanted a measure of estimated efficiency. Some guys (e.g. ARodg) don't need to post gaudy passing statistics because they are so unbelievably efficient that they don't need a lot of attempts to win a game. EPA/P calculates the difference between the expected outcome of the drive before a play and the expected outcome of a drive after a play where the QB was involved (handoffs don't count). Elite QBs take each opportunity to move their team closer to scoring. Win Probability Added per Game. I wanted a measure of high-volume success. An elite quarterback should be able to carry the offense on their goddamned back and drag it kicking and screaming towards a win. WPA/G adds up how much each of the QB's plays contributed to a win (using fancy modeling techniques). Sorta-kinda-almost taps into "clutchness" because it's influenced by high-leverage situations like close games and red-zone play. Also gives a bump to mobile quarterbacks. aYPA. We know from other Smarthouse posts that this isn't a particularly predictive measure, but it is just fine as a description: what is the expected outcome of a passing play, measured in yardage gained? An elite QB should avoid sacks, make completions, and have a reasonable target depth. This stat incorporates all of these. Stats retrieved from the AFA website Anybody who's been following the Flacco debate knows that he doesn't top any of these metrics. But maybe he is good enough at all of them to put him in the higher tiers of consistent, quality play? So here's what I did with these five measures. I retrieved each of them for each of the past 5 seasons for each of the top 40 quarterbacks of that season. Then, I found the average across seasons to reflect each player with a single value for each measure (weighted for attempts within each season to adjust for differences in volume between seasons). Then, I derived an "eliteness" measure by calculating the hidden factor that contributes to all of these measures. In other words, these five things all correlate, so we derived that portion of the shared variance between them. The secret sauce that allows a QB to be efficient, successful, and make reliable contributions to wins at a high volume. Specifically, I ran a Principal Components Analysis. The "eliteness" factor explained about 82% of the shared variance. The rate statistics (EPA/P, SR%, aYPA, in that order) were slightly more important than WPA/G, and Completion% brought up the rear (though they all seemed to tap into this secret sauce to some extent). Then, I subjected the "eliteness" score to a Kernel Density Estimation discretization procedure. It sounds fancy, but essentially all we're doing here is drawing a density curve of where quarterbacks scored. One thing we have to set manually is how "smooth" the curve is. For example, if we really crank up the smoothness, we basically see a "normal distribution": most quarterbacks are average, some are bad, and some are good.  But set it to a more sensitive setting, and all of a sudden we can see the "natural" peaks where quarterbacks are clumped together a bit more, and the "valleys" between those clumps.  We are going to split quarterbacks at the valleys to make tiers. But enough of the fancy poo poo. Here are your definitive quarterback eliteness tiers (in order from high to low within each tier) Tier 1: Aaron Rodgers. A tier to himself. Truly a god among men. Tier 2: Peyton, Brees, Brady. Sounds about right so far. Tier 3: Romo, Ryan, Ben, Rivers. Uh oh, no Joe! Tier 4: Wilson, Eli, Schaub '10-'13 (lol), Luck, Stafford, Kitna '10, Cousins '14, Cam, eight other people, Flacco, Tannehill, Vick, Alex Smith. ... Tier 9: Palko, Skelton, Tebow Tier 10: Quinn, Edwards Tier 11: Ryan loving Lindley who is the most extreme outlier of the past five years and was almost incomprehensibly bad. The gulf between Cam and McGloin is roughly comparable to the advantage the Tim Tebow has over Lindley. You will note that Flacco's "eliteness" secret sauce was significantly below Cam, Stafford, Luck, and Wilson, much less the actual Elite tiers. But he narrowly beat Alex Smith, so there's that. 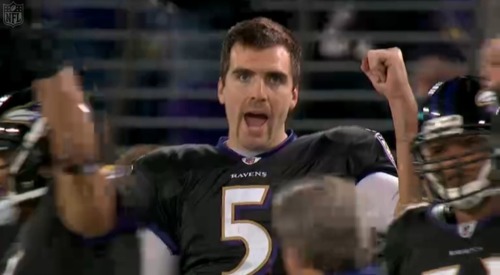 Yaaaaaaaay Amusingly, there is one superhuman demigod that I have omitted from the list. He was way ahead of Aaron Rodgers for the clear top-class quarterback, and it just didn't feel fair to compare him to mere mortals. That man. Is Josh McCown. Specifically, by some fluke of how I culled the top quarterbacks each year, McCown's only season in my database is his 2013 year. He was a destroyer of worlds in his 220-odd attempts, racking up a 66.5% completion rate, a bananas 7.4 aYPA, a 13/1 TD/Int ratio, and a preposterous season QBR of 109. Truly one of the all-time greats. So in conclusion, yes, Josh McCown is an elite quarterback. I'm glad to contribute this rigorous statistical analysis that duly credits one of history's greatest quarterbacks. I expect he will be a first-ballot Hall of Famer. Forever_Peace fucked around with this message at 23:48 on Sep 3, 2015 |
|
#
?
Sep 3, 2015 15:46
|
|

|
Fantastic.
|
|
#
?
Sep 3, 2015 16:08
|
|

|
drat, for some reason I was expecting the superman outlier to be 2013 Nick Foles.
|
|
#
?
Sep 3, 2015 22:18
|
|


|
Fenrir posted:drat, for some reason I was expecting the superman outlier to be 2013 Nick Foles. Well, in this data set, don't forget that 2013 Nick Foles was also averaged together with 2012 and 2014 Nick Foles. That 2013 McCown years was the only one that made it into the database for him, for some stupid reason (might be a bug in where I sourced the data?). But you bring up an interesting point! What is the most elite season by a quarterback! I applied exactly the same procedure to individual seasons. Here's the top 30:  According to this bullshit metric that I made up, all five of Rodger's past five seasons have been among the top 20 seasons by any quarterback over that timeframe (out of about 200 quarterback seasons).  Also 2013 McCown still comes out higher here than 2013 Foles. His success rate was nearly 9% higher and his completion rate was 2.5% higher, which helped make up for his lower aYPA. And the bottom 30:  Skelton makes two appearances in the bottom 6, and a third in the bottom 20. The contributors of two of the 12 worst quarterback seasons in the past five year are currently rostered by the Eagles.
|
|
#
?
Sep 4, 2015 00:03
|
|
|
Forever_Peace posted:And the bottom 30:
|
|
#
?
Sep 4, 2015 00:24
|
|

|
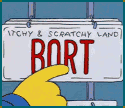
Bort Bortles posted:Balke Bortles isnt on this list...?!? The place where I sourced the data only provides the top 40 quarterbacks each year, as defined by "Win Probability Added" over the entire season. Bort did a lot of things, but contributing to wins was not one of them! edit: To clarify my position here, I think it is super dumb not to cut off QBs by attempts. Like, super dumb. I don't know why they've done it this way. I'd still trust the top of the lists, but the bottoms need to be taken with a few caveats. Forever_Peace fucked around with this message at 00:42 on Sep 4, 2015 |
|
#
?
Sep 4, 2015 00:38
|
|
|
Forever_Peace posted:The place where I sourced the data only provides the top 40 quarterbacks each year, as defined by "Win Probability Added" over the entire season. Bort did a lot of things, but contributing to wins was not one of them!
|
|
#
?
Sep 4, 2015 02:05
|
|
|
Balkan Wartles
|
|
#
?
Sep 4, 2015 03:04
|
|

|
Reposting from August N/V: So, I wanted to see how well Football Outsider's projections match up with the actual end-of-season results. They started posting projected DVOAs in 2006, so I've got nine years of projections to work with. Because DVOA is a black box that might change from year to year, and because I'm lazy, I used each season's rankings instead of actual DVOAs. Because I'm a chump, I did this in Excel. Because I am not a statistician, there may be major mistakes in here that I will correct if found. But here are the numbers. code:code:code:code:FO's Seattle projections are all over the place. They're the only team that has ever received a 1st place (2006) and 32nd place (2011) prediction. code:Seattle's results actually are all over the place. In fact... code:Now, here are the results for how well the projections matched reality. With Spearman correlation, the closer you are to 1.0 or -1.0, the stronger the relationship. code:code:
|
|
#
?
Sep 4, 2015 03:13
|
|
|
Forever_Peace posted:(Interesting stuff and math) Makes you wonder just what the hell happened to Schaub, considering he's got one of the top 30 seasons in 2012 and one of the 30 worst the very next year.
|
|
#
?
Sep 4, 2015 12:23
|
|
|
Cruel and Unusual posted:Reposting from August N/V: I am glad you reposted this because it was the first time I had seen someone do a smackdown of DVOA and proved that it's bullshit. You should have Ehud put it up on FART and we can start a campaign to get "smart" football writers to stop citing it.
|
|
#
?
Sep 4, 2015 14:44
|
|
|
axeil posted:I am glad you reposted this because it was the first time I had seen someone do a smackdown of DVOA and proved that it's bullshit. This doesn't really prove that at all. Besides the problems with doing this sort of arithmetic on ranks (which are not a ratio scale), he's looking at how the pre-season DVOA projection matches up to actual results, rather than how DVOA matches up to results. The pre-season DVOA projection explicitly has a bunch of hand-fudges and rear end-pulls in it (whereas regular DVOA only has these implicitly  ) that reflect the consensus guesstimate of how FO's writers think a team has changed over the offseason. ) that reflect the consensus guesstimate of how FO's writers think a team has changed over the offseason.Also, going from a power ranking (like DVOA) to a ranking based on actual W-L record without adjusting for strength of schedule is not going to match up perfectly even if the power ranking is a perfect platonic-ideal measure of good-at-football-ness. If you had access to FO's formula for calculating win probability based on the DVOA of both teams (which is proprietary, of course, because they are assholes) or your own formula to calculate that and a copy of the schedule for the season in question you could calculate the expected number of wins for each team for that season and then rank the teams by expected wins and compare that to actual wins and that would be a better measure of how good their pre-season DVOA ratings are. None of this should be interpreted as praise of DVOA btw, which has plenty of problems.
|
|
#
?
Sep 4, 2015 14:57
|
|
|
axeil posted:I am glad you reposted this because it was the first time I had seen someone do a smackdown of DVOA and proved that it's bullshit. It's a very cool analysis, but it could very well be that wins in the NFL are noisy enough that it's not actually possible for a different metric to be any better. In stats, we recognize three main sources of prediction error: bias, variance, and irreducible error. Bias is a systemic error in your predictions usually due to bad modeling assumptions, e.g. "predicting too many wins for the high-ranking teams from the previous year", or in some models, "predicting too few wins for the Cowboys every year". Variance is a random error in your predictions usually due to idiosyncrasies of the "training data", or the data that you happened to use to decide what is important for predictions in the first place (and how to make them). E.G. a world where Peterson plays for MIN in 2014 is a lot different from the world where he didn't - the particulars of all the random injuries and fumble recoveries etc. that happen each year can be a big source of noise. Theoretically, if we had the "true" model (e.g. of what predicts a win exactly, without bias) and an infinite amount of data (so that Variance isn't an issue because "infinity" doesn't have a lot of "particulars"), bias and variance can be reduced to zero*. HOWEVER, even then we couldn't make perfect predictions, because of: Irreducible Error, or the noise inherent to the outcome that can never be accounted for regardless of the amount of information we have at hand. I.E. the noise term that exists in the "true" model and cannot be reduced by any model. It's possible that the measure of "Wins" in the NFL just has a lot of irreducible error, i.e. that no prediction could ever be very good. On the other hand, it's also completely possible that DVOA-based predictions have a lot of bias and variance, and that other metrics could perform a lot better over the long run. One thing that I think makes for a good comparison is vegas lines. There is a lot of money riding on making the best possible predictions. If Vegas lines are better than DVOA-based predictions over the long run, it is a clear indicator that the problem here might be bias and/or variance. On the other hand, if DVOA and vegas lines are pretty comparable, it could be an indicator that both are close to reducing bias and variance as much as could reasonably be expected, and that the problem here is irreducible error. But even irreducible error isn't insurmountable either. It could be that some other outcome is less noisy than wins, and can be predicted with less irreducible error. I might suggest pythagorean wins and "gamescript" (the average score differential over the course of the game) as outcomes that may be easier to predict. *It's worth mentioning that in the real world, bias and variance often trade off with one another, all else held equal. If I go out of my way to build a model that really explains past data well, I'm likely to have low bias but high variance (i.e. the model will be overly dependent on the fluky randomness that happened to be in my data set from previous years). In contrast, if I go out of my way to build a super simple model, I'm likely to have high bias (i.e. the model will omit a bunch of stuff that actually does matter) but low variance. Of course, somebody who is very bad at predictions can certainly develop a system with high variance AND high bias.
|
|
#
?
Sep 4, 2015 15:25
|
|
|
Yeah my suspicion is that wins in the NFL are kind of flukey and high-variance. Score margin might be a better variable to model on than actually winning.
|
|
#
?
Sep 4, 2015 15:28
|
|
|
Yeah, I was specifically comparing their projections with their actual calculated DVOA, so this doesn't include wins or other results. The given rationale for DVOA seems fine and it could be a useful descriptive statistic. But with their projections not being particularly special it's hilarious to see how precise they get each year.
|
|
#
?
Sep 4, 2015 15:51
|
|
|
Cruel and Unusual posted:Yeah, I was specifically comparing their projections with their actual calculated DVOA, so this doesn't include wins or other results. The given rationale for DVOA seems fine and it could be a useful descriptive statistic. Ha, yeah I totally misread what you were doing there. Projected DVOA vs. Final DVOA is totally fair. Consider my comments musings on NFL projections that is tangential to your efforts. My bad!
|
|
#
?
Sep 4, 2015 16:05
|
|
|
Cruel and Unusual posted:Yeah, I was specifically comparing their projections with their actual calculated DVOA, so this doesn't include wins or other results. The given rationale for DVOA seems fine and it could be a useful descriptive statistic. D'oh. That's on me for misreading things. Still, I get the sense that DVOA isn't that great of a predictor when compared with other predictors. If you build a really complicated model it should well outperform simple comparisons. I wonder what it'd look like if I made a model and plotted a Receiver Operating Characteristic curve for it... https://en.wikipedia.org/wiki/Receiver_operating_characteristic Although I guess the problem is that this isn't really a logistic world as it's not attempting to predict a binary. Maybe if you re-calibrate it to playoffs/no playoffs?
|
|
#
?
Sep 4, 2015 16:18
|
|
|
I wonder how much of this data most GM's use. Do they have stuff even more in depth than that awesome QB post?
|
|
#
?
Sep 5, 2015 08:02
|
|

|
effectual posted:I wonder how much of this data most GM's use. Do they have stuff even more in depth than that awesome QB post? It really depends on the team. Every team should have a thriving analytics department because teams make money hand over fist but are limited by a salary cap in what they can spend on player contracts. But there is a big number of teams that have gone full Barkley and think that all analytics are crap (and not just the lazy stuff I like did above). This may shock you, but two of those "analytics are dumb we decide with our guts" teams are the Redskins and the Jets. Somebody at the recent sloan analytics conference put together a slick website for ESPN ranking and discussing how every team in every major sport appears to utilize analytics. There's some obvious ones among the most stat-dependent teams: Ravens, Pats, Cowboys, Eagles. But also some that are trying to get some analytics emphasis going with mixed success: the Jags have a nepotism-heavy stats department (Shahid Khan's son is a stat guy who convinced the team to continue playing Gabbert because he was good against 6-man rushes or some irrelevant poo poo), and Andy Reid brought Mike Frazier with him from Philly to help inform his playcalling (particularly the de-emphasis on the run game, which is drawn from very reliable league-wide analysis that probably isn't a great fit for a team with JCharles and Alex Smith). My favorite story I think is the Browns quarterback study. The Browns launched a big analytics-minded scouting team in 2012, and commissioned a big independent study in 2014 to identify the best quarterback in the draft class. The stats people identified Teddy Bridgewater as the best prospect. But by the time the results came back, there had been a front-office shuffle that resulted in Joe Banner leaving, and the new people didn't give a poo poo about the numbers and instead went all-in on Johnny loving Football. For those teams that do use analytics, the type and purpose also tend to vary quite a bit. For example, Chip Kelly's Eagles put a huge emphasis on sports medicine, conditioning, and maximizing player performance. ALL of that is based on empirical models, and they carefully track a ludicrous amount of data from their players. The Seahawks, in contrast, put a lot of emphasis in using measures of athleticism and physical characteristics to identify value during drafts. One Seahawks fan has produced a really great string of like a few dozen articles describing the process that leads them to making seemingly bizarre picks like Sokoli (start from the bottom). And of course, my guys: the Pats. We have Ernie Adams, who is probably the most influential man in football over the past 15 years and nearly completely unknown even to most Pats fans. He's a former wall street guy that relies on a combination of stats, tape, and intimate knowledge of the rulebook to make decisions on personnel (he was supposedly behind the Mankins trade), playcalling, play design (e.g. the antics against he Ravens), scouting and drafting, and scheming. If you asked me who has made the Pats into such a dynasty over the past 15 years, Bill would be at the top, but I'd have to think really hard about whether Brady or Adams was the next biggest contributor. To answer your question, though, pretty much every team that uses advanced analytics (for whatever purpose) does so with much greater depth and sophistication than I have.
|
|
#
?
Sep 5, 2015 13:23
|
|
|
Yeah I think the thing with teams using stats is they have a lot more data to work with. Chip Kelly has accelerometers in all of his players during practice so he can build models on "how well does quick acceleration correlate with receiving yards" or poo poo like that while we can only make very rough sloppy models. This is also the case over in the baseball world. PitchFX is a system the league came up with that uses cameras to accurately track the flight of the ball. It's how they make those cool ball flight graphics during the game so you can see if a pitch really landed in the strike zone. That data was made public and the sabermetrics community took it and used it to make a number of pitching/hitting related stats. Recently MLB finished doing the same system except for every fielder on the field so you can see how fast they move and how quickly they react. This data is NOT public so my guess is the teams have very advanced defensive models while we're stuck with stuff that kinda sucks like UZR. Given how tight lipped football coaches are if they had any sort of advanced model I doubt we would discover it simply because we don't have access to the data they do.
|
|
#
?
Sep 5, 2015 14:59
|
|
|
The most convincing reconstruction of a teams use of analytics is Zach Whitman's work on SPARQ and the Seahawks drafting strategy. Everything else is basically a black box as far as we outsiders are concerned, but Whitman is able to use public data from the combine and pro days to come pretty close. He predicted a number of picks this year even in pretty late rounds.
|
|
#
?
Sep 5, 2015 15:14
|
|
|
Forever_Peace posted:The most convincing reconstruction of a teams use of analytics is Zach Whitman's work on SPARQ and the Seahawks drafting strategy. Is there a website that goes over everything he predicted and how he set up his model?
|
|
#
?
Sep 5, 2015 17:38
|
|
|
It's going to be noisy regardless, but does anyone have a non-manual suggestion for estimating the WR-passing-effectiveness of each team's presumptive-starting QB for each season going back to 1995? It's for WR forecasting purposes, so it has to be a snapshot from the beginning of the season (e.g. for 2008 the NE QB is Brady even though he got hurt in the first game, and the estimate of "WR passing effectiveness" should be based on 2001-2007 or just 2007). I'm saying "WR passing effectiveness" because it's a WR forecast but I would happily settle for just "passing effectiveness". edit: also not "effectiveness", really. "Prolific-ness"... like lots of yards and TDs to WR and who cares about efficiency. This actually isn't for fantasy football but might as well be. pangstrom fucked around with this message at 23:25 on Sep 5, 2015 |
|
#
?
Sep 5, 2015 23:18
|
|

|
Considering what you're going for, I would almost wonder if the total number of targets would be the most important stat.
|
|
#
?
Sep 6, 2015 06:02
|
|
|
Fenrir posted:Considering what you're going for, I would almost wonder if the total number of targets would be the most important stat. pangstrom fucked around with this message at 11:46 on Sep 6, 2015 |
|
#
?
Sep 6, 2015 11:35
|
|
|
So basically what you're looking for is a way to predict the success of a WR coming out of the draft, depending on which QB they end up with? Or moving from one team to another, like Brandon Marshall going from Cutler to Fitzpatrick, or James Jones going from Rodgers to (insert pre-Carr Raiders trainwreck here)?
|
|
#
?
Sep 6, 2015 16:28
|
|
|
Fenrir posted:So basically what you're looking for is a way to predict the success of a WR coming out of the draft, depending on which QB they end up with?
|
|
#
?
Sep 6, 2015 16:35
|
|
|
axeil posted:Is there a website that goes over everything he predicted and how he set up his model? His specific predictions are categorical almost to the point of being qualitative - he analyzes draft classes using the same approach he believes to be utilized by the Seahawks in order to identify probable targets for their late rounds. He predicted Garry Gilliam in 2014 (UDFA) and Sokoli this year (6th), both of which are currently on the final 53 for this season. He's reconstructed a lot of the physical traits he thinks the Seahawks are interested in, reconstructed their SPARQ metric of athleticism, and uncovered quantitative evidence of roster mirroring. Sokoli he was particularly proud/excited about. Dude is the only 4-sigma athlete currently in the NFL (i.e. his SPARQ score is four standard deviations above the average for his position, which is bananas). The only other 3-sigma athletes in the NFL right now are J.J. Watt, Calvin Johnson, Evan Mathis, Lane Johnson, and Byron Jones. His website links to the initial series of articles that described his approach (and made Whitman an instant celebrity in the football stats world). He has since added his analysis of this year's draft class, some analysis relating production to athleticism, some pieces on SPARQ and the approach to drafting and marginal inefficiencies in the draft, and a description of his "similarity score". Forever_Peace fucked around with this message at 17:51 on Sep 6, 2015 |
|
#
?
Sep 6, 2015 17:28
|
|
|
Forever_Peace posted:His specific predictions are categorical almost to the point of being qualitative - he analyzes draft classes using the same approach he believes to be utilized by the Seahawks in order to identify probable targets for their late rounds. He predicted Garry Gilliam in 2014 (UDFA) and Sokoli this year (6th), both of which are currently on the final 53 for this season. He's reconstructed a lot of the physical traits he thinks the Seahawks are interested in, reconstructed their SPARQ metric of athleticism, and uncovered quantitative evidence of roster mirroring. Sokoli he was particularly proud/excited about. Dude is the only 4-sigma athlete currently in the NFL (i.e. his SPARQ score is four standard deviations above the average for his position, which is bananas). The only other 3-sigma athletes in the NFL right now are J.J. Watt, Calvin Johnson, Evan Mathis, Lane Johnson, and Byron Jones. Why did sokoli fall to the 6th if he's so good?
|
|
#
?
Sep 6, 2015 19:30
|
|
|
effectual posted:Why did sokoli fall to the 6th if he's so good? Oh he's quite terrible at football. Eastern European monster that didn't play football until high school and has never held a true position. Hawks want to turn him into a mauler to end all maulers at the OLine.
|
|
#
?
Sep 6, 2015 19:35
|
|
|
Tom Cable would use the Mona Lisa as a cutting board.
|
|
#
?
Sep 6, 2015 19:38
|
|
|
Forever_Peace posted:It's a very cool analysis, but it could very well be that wins in the NFL are noisy enough that it's not actually possible for a different metric to be any better. I love this post. I'm a physicist by training, so the trade-off between these three things was a big focus of my grad education. In general, I still prefer models that explain the highest amount of variance with the simplest possible model. The reasoning behind this in physics is that you have to explain EVERY SINGLE TERM any time you fit ANYTHING - also, overly complicated fits/models may disguise new discoveries, and of course you always want to satisfy Occam's Razor as well. Your point about Vegas Lines is interesting too. I believe it would likely be better than many prediction schemes that are more complicated simply due to the Wisdom of the Crowd. Check out this article about that topic in action: http://www.npr.org/sections/parallels/2014/04/02/297839429/-so-you-think-youre-smarter-than-a-cia-agent. In general, people (who are the ones who build models) are stupid, but if you put a lot of people together you somehow get a smart organism.
|
|
#
?
Sep 8, 2015 23:43
|
|
|
I've been told to ask in here how to make football stats parse easily for 1000 Yards or Bust. Can a magician make this happen for me?
|
|
#
?
Sep 9, 2015 02:20
|
|


|
CzarStark posted:I love this post. I'm a physicist by training, so the trade-off between these three things was a big focus of my grad education. In general, I still prefer models that explain the highest amount of variance with the simplest possible model. The reasoning behind this in physics is that you have to explain EVERY SINGLE TERM any time you fit ANYTHING - also, overly complicated fits/models may disguise new discoveries, and of course you always want to satisfy Occam's Razor as well. I'm an economist by training and your point about Occam's Razor is exactly on point. I've seen so many incredibly complicated models created that are almost indecipherable due to how many terms they have and how advanced the statistical treatments are getting. The math may be legit, but if you can't interpret a model and make policy decisions off if, what good is it? In football terms, you can have the most mathematically beautiful model but if you can't use it to improve your play on the field what good is it? I suppose there's some value in a model that predicts well, but an auto-regressive model almost always gets predictions done the best. And there's no real theory behind it, it's just "past results are the best predictor of future performance." Plus, you can't do anything with an auto-reg model to use it to change the future. It's a crystal ball that let's you look but not touch. And yes, generally if you take an aggregate prediction you can get frighteningly good results. Sometimes I wonder if humanity is evolving towards a hive intelligence, but that really isn't relevant to a football forum.
|
|
#
?
Sep 9, 2015 03:30
|
|
|
I wonder what the difference is between the error of opening lines and the error of final lines for NFL games. Some preliminary googling reveals... almost nothing. Hrmery.
|
|
#
?
Sep 9, 2015 03:32
|
|
|
axeil posted:And yes, generally if you take an aggregate prediction you can get frighteningly good results. Sometimes I wonder if humanity is evolving towards a hive intelligence, but that really isn't relevant to a football forum. You never know...anyone willing to run a survey of what everyone thinks every team's win/loss record will be? We could then check the aggregate results and compare them to actual results at the end of the season.
|
|
#
?
Sep 9, 2015 03:37
|
|
|
CzarStark posted:You never know...anyone willing to run a survey of what everyone thinks every team's win/loss record will be? We could then check the aggregate results and compare them to actual results at the end of the season. That reminds me of how if you poll who people think will win an election instead of who they support, it's a much better predictor for who's actually going to win.
|
|
#
?
Sep 9, 2015 04:09
|
|

|

|
| # ? May 5, 2024 10:06 |
|
|
CzarStark posted:You never know...anyone willing to run a survey of what everyone thinks every team's win/loss record will be? We could then check the aggregate results and compare them to actual results at the end of the season. Well we have the prediction thread... Maybe we can mine that? Although I think only a few people projected out every game so I doubt we would have enough observations...
|
|
#
?
Sep 9, 2015 05:19
|
|