

|
Before last year's Wisconsin - Minnesota game, my friend asked 'Who has longer win streaks than Wisconsin over Minnesota?' After he moved the goal posts a bunch (big time college football, no Army Navy doesn't count, they have to be big schools, no Florida over Kentucky doesn't count because Kentucky sucks too much), I came up with Oregon over Washington and Virginia Tech over Virginia, all tied with Wisconsin over Minnesota's 12. But I realized that's an inefficient way of finding streaks. I grabbed all the results from the Sports-Reference's college football site and threw them into a SQL database. Then, I searched for streaks - basically 'did these two teams play before, and if so did the same team win that time as last time?' Then, I attached how many wins total that team had in the series up to and including that game. The difference in total wins now versus when the streak began is the amount of wins in a row. Here's some of the more interesting, and current results. In addition to the longest current streaks, I also thought it'd be neat to use the amount and length of streaks to measure who's been the best over a period of time - so summing up the streaks and taking their average for both all series and only in conference. Things that may interest only me: Indiana has lost to Michigan and Ohio State 20 and 21 times in a row respectively. Washington has lost to Oregon (12) and Arizona State (10) times in a row. If Wisconsin can keep their poo poo together over Purdue and Minnesota, another win over Indiana (scheduled in 2017) gives them 3 double-digit streaks. If Ohio State is also close to that mark, needing to hold server against Minnesota, Indiana, and beat Illinois 2 more times. I did this more of a thought experiment and practice SQL, so I have no idea where to go with this.
|
 #
?
Feb 28, 2016 20:35
#
?
Feb 28, 2016 20:35
|
|


|

|
| # ? May 5, 2024 13:36 |
|
|
Coco13 posted:Before last year's Wisconsin - Minnesota game, my friend asked 'Who has longer win streaks than Wisconsin over Minnesota?' After he moved the goal posts a bunch (big time college football, no Army Navy doesn't count, they have to be big schools, no Florida over Kentucky doesn't count because Kentucky sucks too much), I came up with Oregon over Washington and Virginia Tech over Virginia, all tied with Wisconsin over Minnesota's 12. Thats cool, but its all wrong because Florida over Kentucky is the correct answer, but I imagine in 20 years it will be Florida over Tennessee.
|
|
#
?
Feb 29, 2016 00:40
|
|

|
I agree. My friend, who is a damned idiot that favors moving his argument around so much it loses all meaning, disagrees. \/\/ yeah, it should be 19 but sportsreference doesn't have a complete history for me to pull from. It's missing the two wins from the 20s. Coco13 fucked around with this message at 18:57 on Mar 12, 2016 |
|
#
?
Feb 29, 2016 02:34
|
|
|
UCLA over SDSU. 17 for 17.
|
|
#
?
Mar 7, 2016 22:23
|
|

|
Just in time for the new season, I have returned! With a SmartHouse gift: with Ehud's permission, I've reposted the NFL stats posts I did last offseason to a new blog, https://footballstatsaredumb.wordpress.com. So far it's just those two old posts up, but coming up in terms of new content is a post about the RB "Curse of 350/370", which I've basically finished the data analysis for, just need to find time to write it up. I have plans for a bunch of posts over the next few weeks, since I'm finished with my PhD and haven't quite gotten a job yet. I'm excited to answer the question "How bad have the Browns QBs been, really?" since that seems like a terrible and fascinating rabbit hole. I also want to do a weekly feature on stupid stats you hear while watching games, like the example in the sidebar (which I made up but isn't far from what I've heard from casters): "No team has ever come back from 17 points down in the 3rd quarter on a Thursday in the Pacific Time Zone since 2004." This I'd need help with though, since I only get the time to watch 3 or so games per week. (I haven't been on in awhile so I wanted to say: daaaaaamn Forever_Peace, that RB analysis is dope)
|
|
#
?
Aug 20, 2016 14:19
|
|

|
Cool, looking forward to it.
|
|
#
?
Aug 28, 2016 11:20
|
|
|
Sorry I didn't get this post up before I had some family stuff to do, but here it is: The Curse Of 350 *spooky Halloween music*. Let me know what you think! Also let me know if you have a better way to get data than manually scraping pages on footballdb.com. I did see the discussion a couple pages back about data, but there didn't seem to be a definitive answer for an extensive data set (both in depth of data available and how far back that data goes). I really like the Python libraries NFLGame/NFLDB, but those only go to 2009 (as far as I can tell) and that's really not enough time for analyses like the one I did here.
|
|
#
?
Aug 31, 2016 04:31
|
|
|
A small post is up on how many passing attempts it should take before a player is considered a "quarterback" rather than just "some guy who threw the ball once or twice." Also I went back through this thread where we talked about the wisdom of the masses and realized that TFF is actually doing detailed win predictions this year! Once those submissions close this Sunday I'll crunch the numbers and see how many wins The TFF Hivemind thinks that each team will get.
|
|
#
?
Sep 10, 2016 03:18
|
|
|
So here's a fun result: This is the result of every drive from 2009-2015, 42,371 of them. I'm actually surprised that more drives end in Touchdowns than Field Goals.
|
|
#
?
Sep 13, 2016 14:00
|
|
|
Yeah that's surprising to me, too (The FG/TD thing). I'm just saying this for your benefit, I am not strident about this stuff, but there is a datavis "NEVER USE PIE CHARTS" thing. Basically brains aren't great with slice area in different orientations and you can get more info (e.g., actual percentages) with less mess if you just use bars or something else. But you still see them all the time and IMO generally they're fine.
|
|
#
?
Sep 13, 2016 14:16
|
|

|
Yeah, I don't really like it for publishing but wanted to post it as a "hot off the presses" sort of thing as soon as I found it out. I also have to combine some of those weird hybrid categories like "Blocked FG, Downs" so that I have fewer break-outs.
|
|
#
?
Sep 13, 2016 14:23
|
|
|
The results are in for the above analysis! I looked at where NFL drives started and the results of drives based on starting location. The idea was to find out if the NFL's rule change regarding touchbacks coming out to the 25 instead of the 20 had any effect on last week's games (and I barely got this one out before week 2 started). I'm aware that I violated Hinchliffe's Rule in the article title. Of potentially more general interest to the SmartHouse community and inspired by pangstrom's post I found this great site that discusses data visualization and the pros and cons of many major chart types: http://www.datavizcatalogue.com/index.html
|
|
#
?
Sep 15, 2016 18:14
|
|
|
CzarStark posted:So here's a fun result: This is beautiful art man. I'm curious if you could show a pie for each year to see if some slices are getting bigger or smaller over time, due to rule changes or something. I know pies aren't the best graphs but they're a good striking visual for an intro before you get into nitty gritty analysis.
|
|
#
?
Sep 21, 2016 20:09
|
|
|
effectual posted:This is beautiful art man. I'm curious if you could show a pie for each year to see if some slices are getting bigger or smaller over time, due to rule changes or something. I know pies aren't the best graphs but they're a good striking visual for an intro before you get into nitty gritty analysis. I can! I think for showing year-to-year changes a scatter plot is better:  This is the outcomes of every drive in a regular season, with the y-axis being percentage of drives with that outcome. You can see that punts stay relatively constant, with TDs and FGs both going up a few percent over time. End of Game and Safety are also fairly constant, though they're a small percentage. Everything else drops. So, as time goes on, more drives end in points than they used to.
|
|
#
?
Sep 24, 2016 23:11
|
|
|
So the 538 ELO system is interesting. http://projects.fivethirtyeight.com/2016-nfl-predictions/ Here's what it shows right now:  You can also get the full ELO history of every team in the NFL, showing the high and low water marks for a team's rating. Here's Philly's for example: http://projects.fivethirtyeight.com/complete-history-of-the-nfl/#phi  The highest ever recorded ELO is the Bears in December of 1942 at 1804. The lowest ever as far as I can tell is from the Brooklyn Dodgers in December of 1946 where they were ranked at a measly 1167. And here's the full methodology write-up. http://fivethirtyeight.com/datalab/nfl-elo-ratings-are-back/ 538, September 2015 posted:A good deal of FiveThirtyEight�s NFL coverage last season used Elo ratings, a simple system that estimates each team�s skill level using only the final scores and locations of each game. For 2015, we�re not only bringing Elo back (with a few small tweaks � more on those in a moment), but we�ve also built a continually updating Elo NFL predictions page that allows you to see the latest rankings, plus win probabilities and point spreads for the current week of NFL games.
|
|
#
?
Sep 26, 2016 05:11
|
|
|
Vikings in third? Aren't they currently starting Sam Bradford?
|
|
#
?
Sep 26, 2016 21:15
|
|
|
CzarStark posted:Vikings in third? Aren't they currently starting Sam Bradford? Edit: also coming off 11-5 season
|
|
#
?
Sep 26, 2016 22:41
|
|
|
CzarStark posted:Vikings in third? Aren't they currently starting Sam Bradford? Elo systems lack context, but auto-correct quickly with more iteration. So it doesn't know who is QB, but if they lost an easy win because of a replacement QB, it would update future win probabilities quickly.
|
|
#
?
Sep 27, 2016 00:53
|
|

|
H/T to the Sports Journalism thread, ESPN apparently has an Analytics portion of their website now and has rolled out a new discussion of QBR. http://www.espn.com/nfl/story/_/id/17653521/how-total-qbr-calculated-explain-our-improved-qb-rating Maybe it still ends up being laughable, but the writer there is Brian Burke of http://www.advancedfootballanalytics.com/ fame. It's also changed from a cumulative (It was cumulative, right? hell if I know maybe it's always been like this) stat to a rate stat. It looks in description an awful lot like QB DVOA without all the "gut check" poo poo they originally folded into it, but multiple systems isn't a bad thing. There's hope? Badfinger fucked around with this message at 17:40 on Sep 28, 2016 |
|
#
?
Sep 28, 2016 17:36
|
|

|
I actually do really like the "expected points added" framework that he developed at AFA (though I'm convinced that his actual model was pretty clunky - he would constantly "bin" measures like field position etc into little categories rather than use something more elegant like Generalized Additive Models). I also like the defensive adjustment approach that sounds Bayesian (and hopefully is). But I think the choice to emphasize rate so much might be confusing to folks, and I'm also not convinced that EPA captures scrambles well (it seems to overweight them). Blaine Gabbert is top 10 per QBR so far, to give an example of why this might be hard to interpret. It's not "wrong" per say, it's just hard to pin down what this actually measures. I wish he'd just tell us the model. What is it with people and their secret models.
|
|
#
?
Sep 28, 2016 18:40
|
|

|
Forever_Peace posted:What is it with people and their secret models. Its what gets them hired by ESPN and the New York Times and stuff. Are you familiar with baseball advanced stats? EPA screams "we smashed Leverage Index and Win Probability Added" together but instead of using a percentage of how likely the team is to win from the new position they mathed out how many points usually get scored from that spot. It's also by nature less refined, because baseball has so many more discrete data points to accurately. Lastly it's supposed to be a scale, with 50 representing average. Apparently it's Lake Wobegon all up on the NFL right now because depending on if you pick raw or adjusted qbr either 24 or 28 quarterbacks in the league are above average. I trust EPA way more than I do QBR.
|
|
#
?
Sep 28, 2016 20:12
|
|
|
Howdy thread, I posted this in another thread and was directed here for help. Does anyone know where I can find weekly offense/defense team stats? Like this but weekly. I am trying to put this together for a buddy of mine in prison who plays in my fantasy football league. The link is basically all the info he wants/needs, but other than pasting it into a spreadsheet and subtracting the weekly differences I can't find a way to get weekly team stats. Any help would be appreciated.
|
|
#
?
Sep 29, 2016 19:03
|
|

|
http://www.pro-football-reference.com/ Not sure if there's somewhere it's nicely laid out the way you want or if you would have to combine several tables but I'm poking around now. Edit: seems like you would have to use a query like this and then run it for every week. Not too much work but maybe some other site has it already laid out in a weekly format. SurgicalOntologist fucked around with this message at 19:12 on Sep 29, 2016 |
|
#
?
Sep 29, 2016 19:06
|
|

|
I got bored earlier in the week and decided to try and calculate some Excitement Indices (the Excitement Index is the total change in win probability over the course of a game), to answer some questions like "Has TNF always sucked?" This is on a 0-X scale where 13 is about the largest I've seen. Average these days is about 4.5. So here we are. Last week's games are below. This tells us what you might expect: the Patriots / Browns game was boring, as was the Bengals / Dallas and Texans / Vikings, while the Chargers / Raiders and the Slurs / Ravens games were pretty good. The one weird outlier is Bucs / Panthers, which is considered the most exciting game of the week. I guess there were a lot of win chance changes, but I don't have a good way to model "cripplefight" yet. 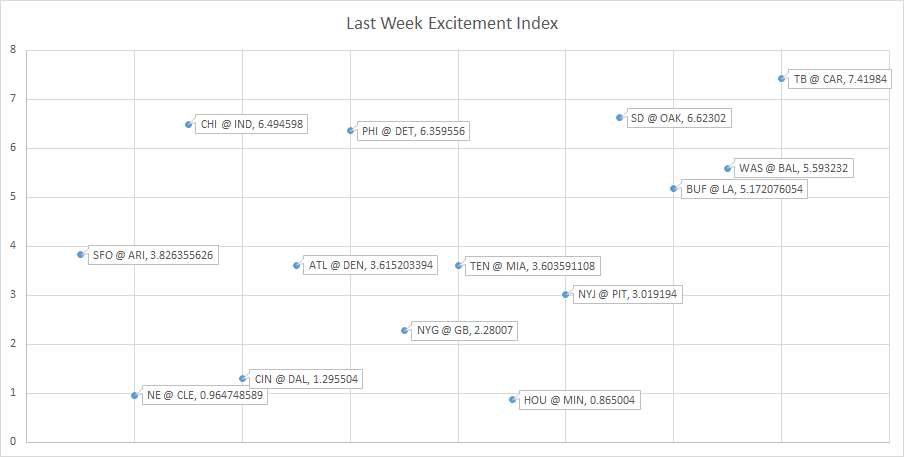 And here's every game from 2002 forward ordered by year, showing the median and mean: 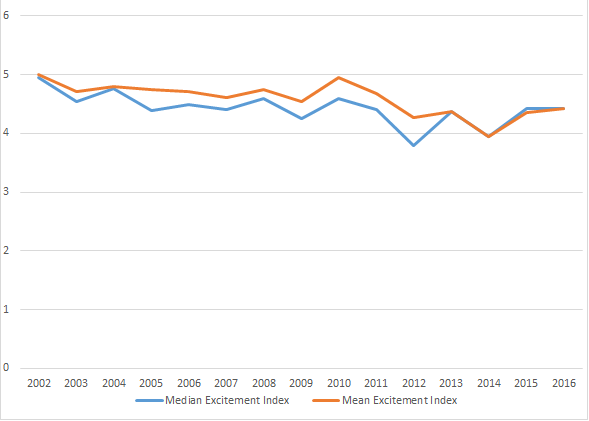 The interesting part here is that there haven't really been all that many changes, suggesting the "you didn't realize how much games without your team sucked before" theory is the right one. TNF broken out (note that TNF as we know it didn't really start until 2006, so the Thursday games before that were special season openers): 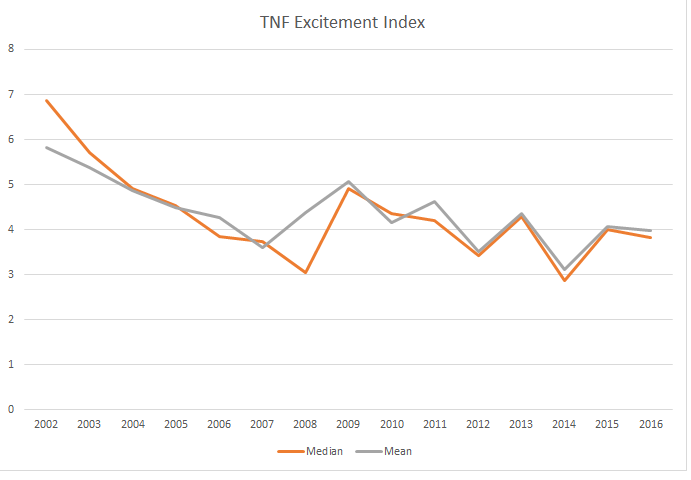 TNF, however, has consistently sucked by comparison to the average game, averaging around a 4 by comparison to all games at 4.5. SNF broken out - these have really gotten worse lately: 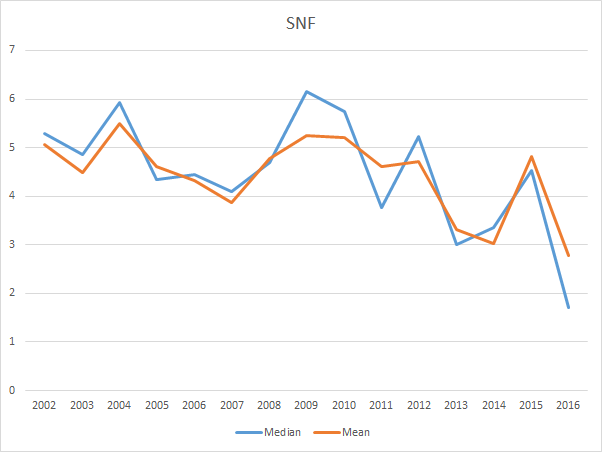 MNF broken out: 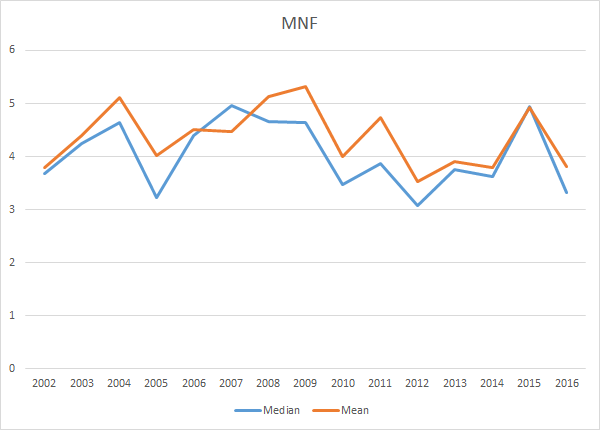 MNF isn't much getter than SNF or TNF; all of them are around a 4 while all games are at 4.5. And finally the scale to compare all games, TNF, SNF, MNF: 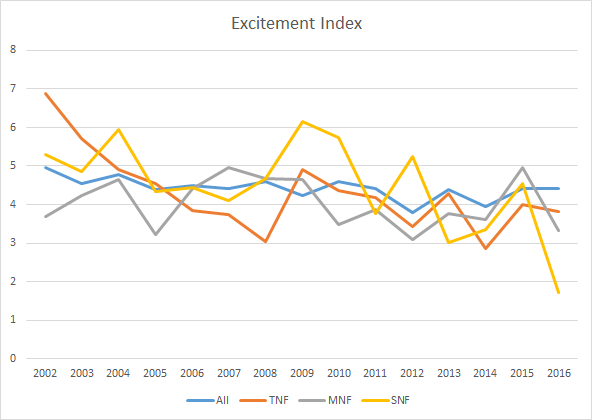 Consistently the prime time games are noticeably worse than the average game. Sorry guys; the NFL has always been bad.
|
|
#
?
Oct 13, 2016 03:41
|
|

|
Cool idea. Is "all" really "all"? It won't change much but it probably should just be "others".
|
|
#
?
Oct 13, 2016 19:17
|
|
|
That is really cool. Can you easilly do the last few years' Super Bowls as well? I know it won't be an average, just out of curiosity.
|
|
#
?
Oct 13, 2016 19:41
|
|
|
That's a great idea for a measurement. Did you come up with Excitement Index? Yeah, I think the categories should be: Sunday day games, TNF, MNF, London games (Sunday morning football), and postseason (which could be broken down further). I would also be interested in seeing error bars, and maybe a plot that isn't broken down by year. There may be a slight difference that is only observable over many seasons (however, this would imply it's such a small effect that it would be impossible to notice on any given game). Or just share your data as a CSV file and see what graphs/models the rest of us come up with.
|
|
#
?
Oct 13, 2016 19:53
|
|
|
pangstrom posted:Is "all" really "all"? It won't change much but it probably should just be "others". CzarStark posted:That is really cool. Can you easilly do the last few years' Super Bowls as well? I know it won't be an average, just out of curiosity. SurgicalOntologist posted:That's a great idea for a measurement. Did you come up with Excitement Index? SurgicalOntologist posted:Yeah, I think the categories should be: Sunday day games, TNF, MNF, London games (Sunday morning football), and postseason (which could be broken down further). SurgicalOntologist posted:I would also be interested in seeing error bars, and maybe a plot that isn't broken down by year. I can switch to a plot calculating mean / median on a weekly basis, but as you can see from looking at the chart of last week each individual week is pretty scattered. SurgicalOntologist posted:Or just share your data as a CSV file and see what graphs/models the rest of us come up with.
|
|
#
?
Oct 13, 2016 22:25
|
|
|
CzarStark posted:That is really cool. Can you easilly do the last few years' Super Bowls as well? I know it won't be an average, just out of curiosity. 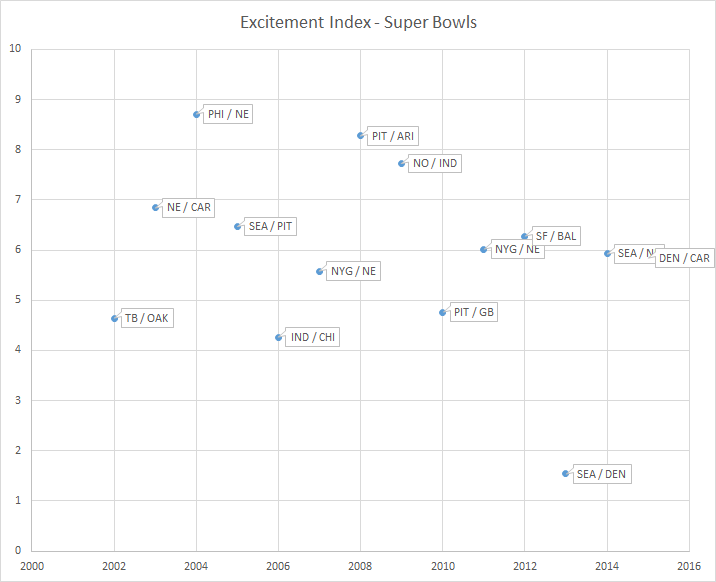 It's about what you would expect - in the modern era Super Bowls have been at least watchable games and usually good, other than 2013. SurgicalOntologist posted:maybe a plot that isn't broken down by year. Sunday day: 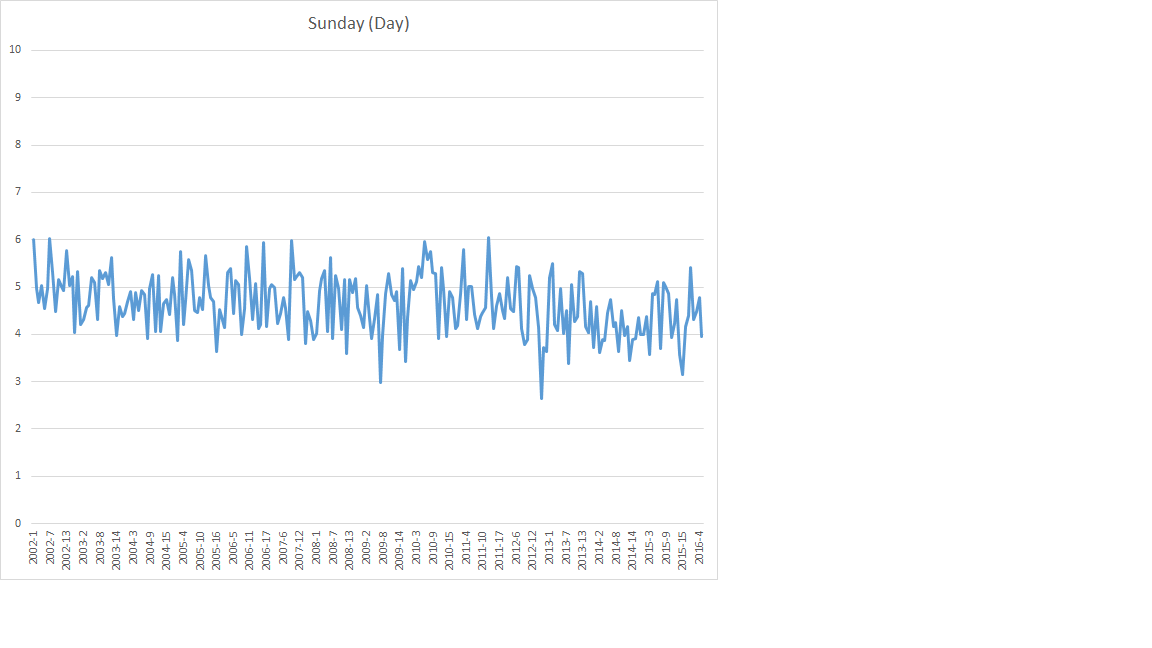 TNF: 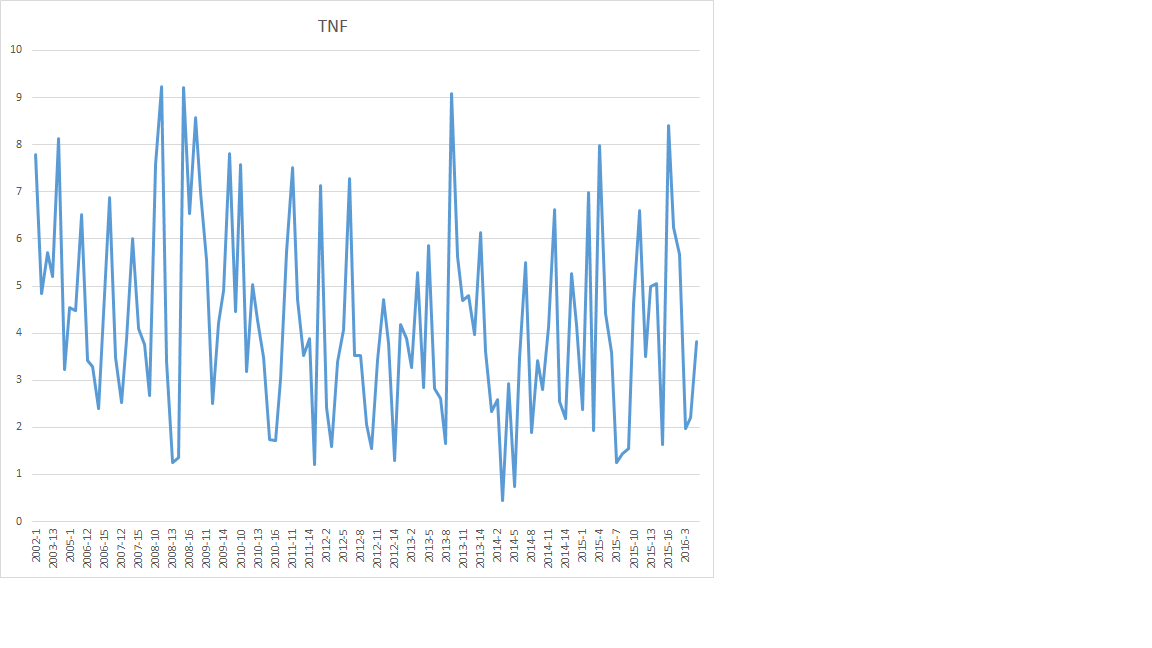 MNF: 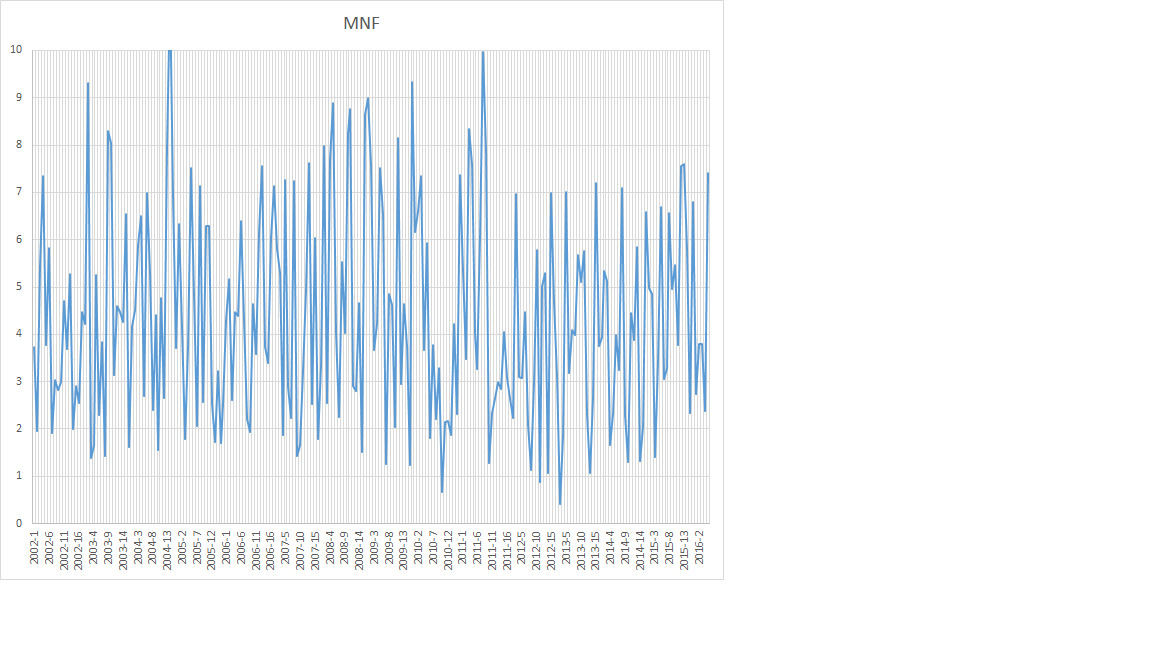 London games at 9:30am Eastern: DET / ATL 2014-10-26: 4.788 NYJ / MIA 2015-10-04: 2.261 BUF / JAX 2015-10-25: 5.484 DET / KAN 2015-11-01: 1.536 IND / JAX 2016-10-02: 5.330 (summary: 3 watchable and 2 garbage). Postseason: 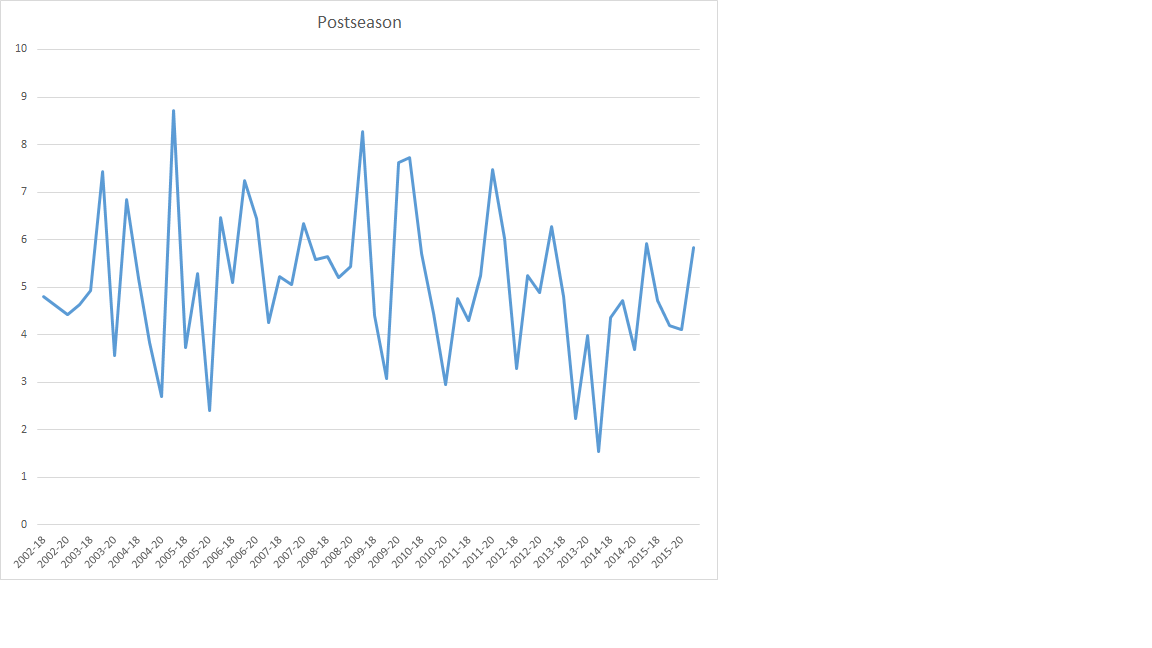 Data: https://drive.google.com/file/d/0B0tSHrLsd6OyUEt0eXdXTXY3bGM/view?usp=sharing In case it's not obvious, the columns are: Home, Away, Date, Season, Week, Weekday, Excitement Index, Start Time, Duration
|
|
#
?
Oct 14, 2016 04:53
|
|
|
ulmont posted:London games only became Sunday morning in 2014 (and only one of them IIRC), so there have only been a handful of Sunday morning London games. ulmont posted:I'm not sure where you are thinking error bars would come from; those are the actual means and medians for the excitement index for the years in question. ulmont posted:I can switch to a plot calculating mean / median on a weekly basis, but as you can see from looking at the chart of last week each individual week is pretty scattered. Thanks for the data! I'll take a stab at it.
|
|
#
?
Oct 14, 2016 05:15
|
|
|
SurgicalOntologist posted:Well, the supposed difference in London games is due to the location, not the day/time, so I still think it's worth treating them as their own category regardless of the scheduling. 1) The 2002 season Super Bowl reports as week 20 not 21. 2) The December 7, 2003 Falcons / Panthers game has a start time of 8:37am. This was a Sunday night game and should be listed as 8:37pm. SurgicalOntologist posted:I meant standard error of the mean. I didn't mention it but I don't think including both mean and median is worthwhile, so just pick one. Mean is just more straightforward but you could calculate the standard error for either.
|
|
#
?
Oct 14, 2016 05:48
|
|
|
This is rad. You could try smoothing out some of these plots using local regression (like LOESS / LOWESS) if they're too full of high-frequency variance to spot any systematic drift. I think it'd also be really cool to see a density plot (or histogram) of overall excitement index values to see how the games vary. SurgicalOntologist is asking "what if we treated these games as independent samples from some bigger population of games rather than as the population itself". Your current treatment is correct (I'm always a fan of unpacking the past without having to bring in inferential statistics at all, because you already have the entire population), but if we wanted to assume that the excitement index is stationary into the near future (i.e. that future games might be draw from the same distribution of excitement indices, which is not an unreasonable assumption to make), you could calculate how precisely you are likely to have measured what that stationary mean excitement index is (using standard error).
|
|
#
?
Oct 14, 2016 13:11
|
|
|
Yeah, this is super cool. Mostly I wanted the Super Bowl plot to see how bad Seattle v. Denver was on this scale, and I wasn't disappointed. Great work! It has inspired me to finally learn scraping, since PFR is a pain in the rear end to manually scrape data from.
|
|
#
?
Oct 14, 2016 14:13
|
|
|
It's weird but I remember almost all of these games pretty vividly except for the Packers/Steelers. I can't think of a single detail or big memorable play.
|
|
#
?
Oct 14, 2016 14:27
|
|

|
That's the only one I didn't watch every second of because I was spending most of that time trying to win a $500 video card. I do remember this though: 
|
|
#
?
Oct 14, 2016 14:51
|
|

|
I think that's the only halftime show I've watched in the last 10 or 15 years. I wanted to see how awful it would be and I was not disappointed.
|
|
#
?
Oct 14, 2016 15:08
|
|
|
Forever_Peace posted:I think it'd also be really cool to see a density plot (or histogram) of overall excitement index values to see how the games vary. 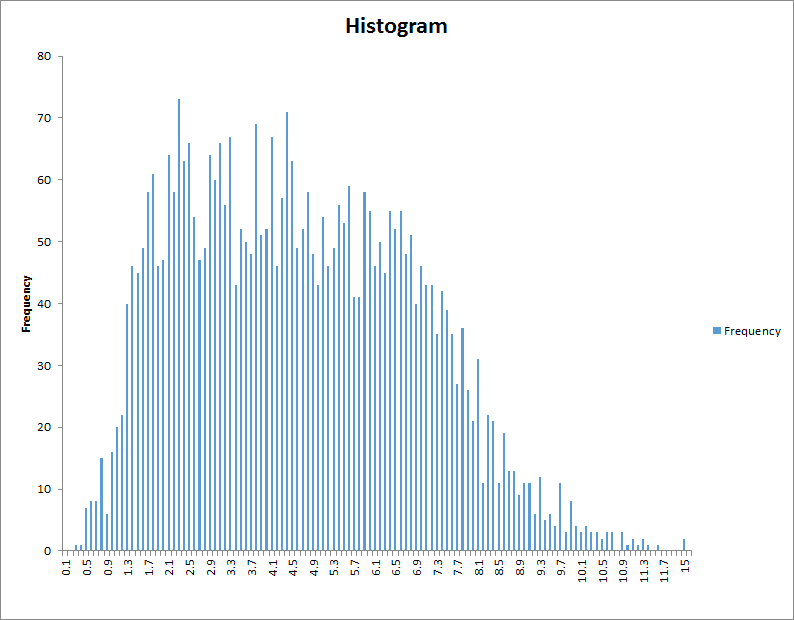 For those of you saying that's too many bins, there are 3815 data points so I could go as high as around 200 bins. I'll play around with LOESS / LOWESS tonight. SurgicalOntologist, the file I uploaded seems to have some trash after row 3815, but it's all duplicates so just kill it.
|
|
#
?
Oct 14, 2016 16:04
|
|
|
What are those most/least exciting games?
|
|
#
?
Oct 14, 2016 16:11
|
|
|
pangstrom posted:What are those most/least exciting games? Seconding. I would love to see box scores and/or quarter by quarter scoring on the few least/most exciting. Like how bad of a beat down does it have to be to get an index < 0.5?
|
|
#
?
Oct 14, 2016 16:24
|
|

|
|
| # ? May 5, 2024 13:36 |
|
|
pangstrom posted:What are those most/least exciting games? Here's the top 10 most exciting: pre:Buffalo Bills Minnesota Vikings 9/15/2002 13.4587 San Francisco 49ers Arizona Cardinals 11/25/2007 12.4611052 New Orleans Saints San Francisco 49ers 1/14/2012 11.505491 Philadelphia Eagles Cincinnati Bengals 11/16/2008 11.325778 Kansas City Chiefs Tennessee Titans 12/13/2004 11.28096863 Denver Broncos San Diego Chargers 12/1/2002 11.277594 Atlanta Falcons Minnesota Vikings 12/1/2002 11.190186 St. Louis Rams Jacksonville Jaguars 10/18/2009 11.097628 Atlanta Falcons New Orleans Saints 9/26/2010 11.00994 New York Jets Oakland Raiders 10/19/2008 10.963298 You may recall that the 3rd game in that list came down to Gregg Williams being unable to loving have people cover Vernon Davis. Look at how the Win Probability goes back and forth, with the 49ers generally ahead, and then just starts swinging wildly back and forth. Final score 36-32. 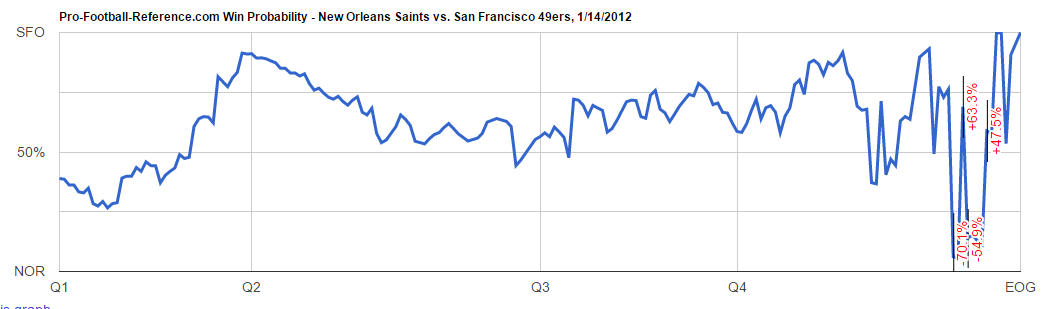 And here's the bottom 10 least exciting: pre:Jacksonville Jaguars Seattle Seahawks 9/22/2013 0.230944 San Francisco 49ers Jacksonville Jaguars 10/27/2013 0.33883087 Oakland Raiders Denver Broncos 9/23/2013 0.406242 New England Patriots Miami Dolphins 10/21/2007 0.408118575 Tampa Bay Buccaneers Atlanta Falcons 9/18/2014 0.45244 Tampa Bay Buccaneers Atlanta Falcons 1/1/2012 0.473834 New England Patriots Buffalo Bills 11/18/2007 0.486417194 Denver Broncos New England Patriots 1/14/2012 0.490942 Oakland Raiders St. Louis Rams 11/30/2014 0.495718 Denver Broncos Oakland Raiders 12/29/2013 0.505520694 Let's look at the second game in the list for another 49ers game. This is pretty typical - the heavily favored team (here, something like 85% favored) just steps on the gas. This was a 42-10 beatdown. 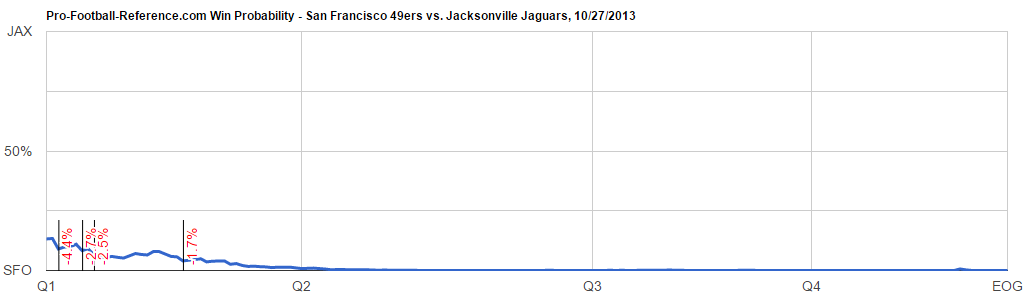 RVProfootballer posted:Seconding. I would love to see box scores and/or quarter by quarter scoring on the few least/most exciting. Like how bad of a beat down does it have to be to get an index < 0.5? It has to be real bad - the favored team has to take the lead and never let up. For the JAX / SF game: Q1: 7-0, 14-0. Q2: 21-0, 28-0, 28-3. Q3: 28-10, 35-10. Q4: 42-10. On the reverse, exciting version: Q1: 0-7, 0-14. Q2: 0-17, 7-17, 14-17. Q3: 14-20. Q4: 17-20, 17-23, 24-23, 24-29, 32-29, 32-36.
|
|
#
?
Oct 14, 2016 17:49
|
|