


|
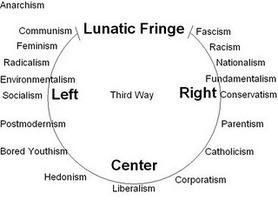
I'm pretty sure "Racism" is not a political philosophy. Also poor little anarchy off in the corner there.
|
 #
¿
Mar 28, 2016 22:42
#
¿
Mar 28, 2016 22:42
|
|


|

|
| # ¿ May 11, 2024 11:07 |
|
|
Yeah I mean that PARTICULAR diagram is stupid because of all the labels just kind of stuck on there arbitrarily without any real regard for what it's supposed to mean, but the actual shape is a pre-existing thing and it's meant to look like that. The theory is that the absolute extreme ends of the political spectrum are closer to each other than they are to the center, as the farther you go the more you trend towards different flavours of dictatorship. Of course, it's still a dramatic oversimplification of political ideology since it still fundamentally assumes that such a thing as "left - center - right" exists rather than politics being a complex web of hundreds of different issues.
|
|
#
¿
Mar 29, 2016 01:12
|
|
|
Aramek posted:It's a fun side effect of how retarded libertarian "beep, boop, use of force?" thought processes are. Yeah considering they few taxation as "unlawful coercion" I don't think they're using the same scale for "use of force" as the rest of the world.
|
|
#
¿
May 12, 2016 00:26
|
|
|
Absurd Alhazred posted:Ars Technica has been a tech news and analysis site for ages, I remember reading them mostly about hardware, new CPU technologies and such back in the day. Pretty sure that's how I first learned about VLIW architectures. Are they even that focused on gaming? Obviously not. They're part of the SHAME industry. Didn't you read the chart?
|
|
#
¿
May 25, 2016 17:44
|
|
|
FPzero posted:I'm curious how you quantify black inequality. Well you could probably do some kind of statistical comparison between white income and black income for people with the same level of education working the same jobs, as well as comparing stuff like the % of high income jobs that are done by black people compared to the overall % of black people in the general population. But that all sounds like a lot of work and it would be a lot easier to just make something up and draw a blurry graph with a red line going up.
|
|
#
¿
Jun 3, 2016 02:26
|
|
|
MrUnderbridge posted:And weren't the puritans pretty far from libertarian? Yeah if anything the puritans were pretty high on the authoritarian scale. Although there's also evidence that they didn't actually wear those belt-buckle hats so maybe it just means that people who dress up as puritans at renaissance fairs are centrist-libertarian.
|
|
#
¿
Jun 13, 2016 20:44
|
|
|
Fathis Munk posted:There are so many reagents we use that are hilariously expensive. When you actually start thinking about the value of the things you handle it gets a bit daunting sometimes. What's the price per kg of antimatter?
|
|
#
¿
Jun 29, 2016 21:08
|
|
|
I do like how that diagram implies there is some hypothetical overlap between "real doctors" and "real worms".
|
|
#
¿
Jun 30, 2016 01:34
|
|
|
dijon du jour posted:The premodern era is also commonly known among academics as the era of God just constantly loving our poo poo up with lightning bolts. I guess so? I actually understand most of what this little graphic is going for aside from the "meme" bits (what do the black/white colours mean? Who knows)
|
|
#
¿
Jul 1, 2016 16:20
|
|
|
Everyone knows the weapon of choice for homicides in Russia is car.
|
|
#
¿
Jul 5, 2016 19:55
|
|
|
Baronjutter posted:The police only arrest or take action if they know they'll get a conviction To be fair the American legal system does this too. Because of double jeopardy police generally won't charge people unless they're absolutely sure they can get a conviction, since if the person is acquitted at trial and later evidence turns up that 100% proves their guilt, oops, too late, you can't charge them again. The rest of that sounds pretty awful though. I kind of wonder how much influence the Yakuza has had on that system, considering that they operate more or less openly in Japan and have had influence over government officials in the past. It seems like a system that would seriously favour organized crime - all you need is a fall guy and the police will be happy to charge them with everything your organization has done, effectively letting everyone else off the hook.
|
|
#
¿
Jul 6, 2016 01:27
|
|
|
The weird thing is the game isn't nearly complicated enough to justify that chart. The same information could be conveyed in a much simpler fashion. Which I guess is basically the thesis for this thread.
|
|
#
¿
Aug 2, 2016 19:43
|
|
|
Carbon dioxide posted:Apparently it was made to 'prove' that weed is bad. Well it must be if being high makes you produce a graph like that.
|
|
#
¿
Aug 8, 2016 19:06
|
|
|
Somfin posted:That's true. But car crashes are wildly more frequent than plane crashes. An individual car crash is less likely to be fatal, and the death count in a fatal car crash is naturally going to be much lower, but there are so so many orders of magnitude more car crashes than aviation crashes that, on aggregate, death by car crash is much, much more likely than death by plane crash. Yeah but plane crashes are just more dramatic than car crashes so people are more likely to remember hearing about them, and thus believe they're more common than they actually are. The same reason people are afraid of terrorist attacks, really. Also as you said, people are more likely to die in any individual plane crash than any individual car crash, and people are bad at thinking about overall statistical trends so they just compare individual examples in their head and conclude that plane crashes are more dangerous because they're more deadly.
|
|
#
¿
Aug 9, 2016 14:31
|
|
|
Strudel Man posted:Well, the math on that's not so bad. It's the placement of the single-month and six-month totals on a line plot with previous annual totals that's such a magnificent offense against earnestness that I'm saving it for my stats students. Yeah my initial look at that and I didn't think there was anything wrong with it until I noticed the last two labels on the X-axis.
|
|
#
¿
Aug 22, 2016 15:25
|
|
|
spongepuppy posted:At work we have a web design job for a tutoring service whose current site features this gem: I feel like including a graph this stupid in a website for a tutoring service would actually serve to drive people away from said service. I mean if they don't know how graphs work how would anyone expect them to teach kids how to do it?
|
|
#
¿
Sep 26, 2016 16:16
|
|


|
pik_d posted:States well known for no one ever wanting to move there: New York Well sure. Nobody wants to live there. There's too many people.
|
|
#
¿
Oct 16, 2016 16:13
|
|
|
I like the extra touch that it's not just a straight line. That's how you know it's real data.
|
|
#
¿
Oct 24, 2016 01:45
|
|
|
I think the size of the slices actually does make sense but it's very poorly presented - if you ignore the "86.33%" number and pretend the red slice is orange, it all works out. Then the red slice is the proportion of the total orange slice that goes towards teacher's raises (86.33% of that slice, so about 60% of the total pie). It does fail at the #1 purpose of a chart though, which is to present information in a way that makes it easy to understand.
|
|
#
¿
Nov 6, 2016 19:56
|
|
|
I like that they chose not to abbreviate or use commas in the Y-axis. Because people traditionally understand large numbers super well, right?
|
|
#
¿
Nov 10, 2016 02:41
|
|

|
NoEyedSquareGuy posted:From Matt Taibbi's recent article on Thomas Friedman's new book: Oh poo poo, so all this time the solution has been "do things better"? This man is a genius!
|
|
#
¿
Nov 28, 2016 22:14
|
|


|
Pakled posted:I'm the 2% of Hillary supporters who believe she's an actual demon. She's an actual demon, but still the lesser of two evils.
|
|
#
¿
Dec 5, 2016 19:36
|
|
|
The founding fathers: people who are apparently opposed to statehood who somehow also created one of the first modern states. Yeah that all seems to check out.
|
|
#
¿
Dec 9, 2016 20:12
|
|
|
Please keep your fetishes to yourselves.
|
|
#
¿
Dec 29, 2016 03:52
|
|
|
The info on this chart is fairly clear but I have no idea what kind of point it's trying to make. That somehow not facing major leadership shakeups makes the Lib-Dems unelectable? If anything I would think having stable leadership would have the opposite effect. But then I don't know UK politics. Although I do like how they have their scale in 0.5 increments. How do you hold 0.5 of a leadership election?
|
|
#
¿
Dec 31, 2016 22:17
|
|

|
Why haven't they caught the toddler yet?
|
|
#
¿
Jan 4, 2017 01:16
|
|
|
Phanatic posted:No argument. gently caress at this point I thinking picking adults at random for presidential terms, no repeats, is better than what we do. Outrail posted:I've heard more then one comment t along the lines of 'I'd rather any American citizen between the ages of ~35-60 picked at random than Trump. No take backs'. And at least one of them was cognizant that the average person is a terrible choice for president. Just make it so that the term for this system is a month long. Nobody really does any lasting damage, everyone feels like they have a pretty good chance at their turn. You get to throw a nice big party every month for each inauguration.
|
|
#
¿
Jan 18, 2017 05:39
|
|
|
Fathis Munk posted:... 10.
|
|
#
¿
Jan 30, 2017 22:51
|
|
|
I mean, to be fair, the thing it's modelling is fairly complicated but maybe just use more than one graph?
|
|
#
¿
Feb 9, 2017 03:11
|
|

|
ToxicSlurpee posted:I've heard libertarians unironically explain that it's totally OK for a person to sell themselves and their offspring into slavery because in a truly free society somebody with wealth would never, ever (ever ever ever!) rig the game in a way that ensured there were people so poor they'd be required to sell themselves into slavery just to survive. No but see the laws preventing people from doing this are the real tyranny.
|
|
#
¿
Feb 21, 2017 05:10
|
|
|
ToxicSlurpee posted:The Austrian school just goes "well nobody has used our ideas hard enough yet. The problem is them not us." I wonder how they feel about the fact that this is the exact same argument people make in favour of communism.
|
|
#
¿
Feb 24, 2017 04:33
|
|
|
It's almost like pyramid schemes are designed to funnel all the money to the people at the top.
|
|
#
¿
Mar 6, 2017 03:08
|
|
|
ToxicSlurpee posted:It's less that it's rude in our society and more that MLM always has a way to convince people that you're the jerk that doesn't want them to succeed and they'll totally laugh at you when they're millionaires and you aren't. Yeah it's pretty much the same playbook as cult indoctrination. It's not "rude" to try to get someone out of something like that, but they'll react with hostility because they've been convinced to trust the scam more than they trust their friends.
|
|
#
¿
Mar 6, 2017 05:58
|
|
|
Regalingualius posted:...90% of what? 90% of 100%
|
|
#
¿
Mar 7, 2017 07:08
|
|
|
I feel like every news network seems to have at least one graphics guy that understands that you need to display statistics on a graph, but beyond that has no idea what a graph is or how they work.
|
|
#
¿
Mar 12, 2017 00:10
|
|

|
goose willis posted:The y-axis measures justice so the higher they are the more justice you get Length of name.
|
|
#
¿
Mar 22, 2017 03:35
|
|
|
Fathis Munk posted:I still haven't figured out if the position of the small circles within the big concentric circles means anything. It's the general category of business, designated by the colour based on the little legend in the top right.
|
|
#
¿
Mar 23, 2017 18:18
|
|
|
Gorilla Salad posted:Many years ago, when I was a young student, our maths teacher was trying to explain the idea that some values are relative to other. Honestly I understand this concept and I still screw up all the time when trying to do the math in my head quickly. It's one of those things that people seem to be very poorly wired to handle.
|
|
#
¿
Mar 30, 2017 18:07
|
|

|
Reddit seems like it must be a great resource for the FBI and NSA and so on. It turns out you don't need to secretly monitor people's private conversations at all - they're perfectly willing to express their horrible violent beliefs in a big public forum.
|
|
#
¿
Mar 31, 2017 21:07
|
|
|

|
| # ¿ May 11, 2024 11:07 |
|
|
Outrail posted:Why the hell would you think average home price going up is a good thing? Aside from loving over young and poor people. Kind of answered your own question there. It IS a Fox News graphic.
|
|
#
¿
Apr 2, 2017 06:28
|
|