


|
Gamma Nerd posted:uh check the article please, yearly emissions have been pretty much static for the past 3 years. i know you want to jerk off about how hosed we are, and i agree that our emissions rates are really loving high and it'll be a challenge to lower them fast enough... but the facts are that emissions rates have been globally static for the past 3 years It's like just showing up to run a race where the rest of the participants are nearing the finish line. And democracies aren't exactly The Flash. The climate, on the other hand...: quote:At the end of October and the beginning of November the PV underwent an unprecedented early split. The PV has since remained relatively weak and the models are predicting further weakening with more aggressive model forecasts predicting a major mid-winter warming before the month of November concludes. I question whether the PV will enter MMW territory before month�s end (the earliest MMW observed is currently November 30th 1958) but regardless further weakening appears likely. The potential for Sudden Stratospheric Warming. Always a blast.
|
 #
¿
Nov 16, 2016 03:41
#
¿
Nov 16, 2016 03:41
|
|


|

|
| # ¿ May 15, 2024 03:37 |
|
|
Telling people is nice and all. Here's something to tell them - the city of Utqiaġvik (formerly Barrow), Alaska recorded 30.1 degrees Fahrenheit average temperature for the month of October. It sits 320 miles into the Arctic Circle, and its average temperature was barely under freezing. On October 10th, it reached 44 degrees Fahrenheit for a new record high. Oh - one other thing - its 1981-2010 average temperature for October was 17.2 degrees Fahrenheit.
|
|
#
¿
Nov 16, 2016 04:24
|
|
|
Non-U.S. people generally accept that poo poo is hosed. Evil_Greven posted:
|
|
#
¿
Nov 16, 2016 04:55
|
|
|
Nice piece of fish posted:Yeah, but surely that's still going to be happening over a significant amount of time? I mean, we're talking next century at the minimum, regardless of the inevitability of it. It's thought that it can happen rather rapidly. It's anyone's guess as to when it might happen, though. e: Arctic Nov 17 2016: 1.77 million square kilometers below average area e2: Global Extent, updated daily Global Area, updated daily These three are from forum.arctic-sea-ice.net e3: I haven't harped too much on November's craziness, since the two poles are quite different... but I want to point out something: Every year, the June peak is smaller than the November peak - except this year. Evil_Greven fucked around with this message at 01:05 on Nov 19, 2016 |
|
#
¿
Nov 19, 2016 00:08
|
|
|
Sure. It's possible to trap CO2, and there are a variety of methods to do so. As to how much CO2 we can emit... at this point? It would have to be negative emissions. Do we have the will to do so on a grand enough scale that it matters, though? That remains to be seen. Speaking of, here's some more fun: https://twitter.com/Weather_West/status/799705160796672000 Forecast heat into December... wonder what will become of the sea ice in the Arctic at that point? Evil_Greven fucked around with this message at 01:26 on Nov 19, 2016 |
|
#
¿
Nov 19, 2016 01:23
|
|
|
Speaking of things falling into the sea: https://twitter.com/lenaertsjan/status/798128755248164864 Yes, it's what it looks like: Greenland melt is exceeding RCP8.5 maximum projections. e: For those new to this sort of thing... RCP8.5 is the worst-case scenario. Temperature wise, it's bad. +4 degrees Celsius by 2100. +8 degrees Celsius by 2300 and still climbing. e2: Although, to be fair, it estimates +1 degrees Celsius by 2040, so... don't look too hard at the temperature this year and last. Evil_Greven fucked around with this message at 02:38 on Nov 19, 2016 |
|
#
¿
Nov 19, 2016 02:25
|
|
|
For some estimates, yes. In others, like Arctic sea ice melt, we're actually a little past when it was projected to happen (ice-free during summer 2015 or 2016, depending on source). Temperatures, though... not looking so great (YTD 2016 is at +0.97 degrees Celsius; 2005 is the light speck below 5 in 2015) : Evil_Greven fucked around with this message at 03:01 on Nov 19, 2016 |
|
#
¿
Nov 19, 2016 02:56
|
|
|
Potentially. The Global sea ice area looks somewhat worse due to Antarctic sea ice melt, but the Arctic is the lowest on record at this point in the year as well. Both areas of sea ice depend a lot on the weather and ocean. 2012 was almost as low at this point in the year, but sea ice recovered somewhat. Still, volume is another matter altogether - and so far, it doesn't look good for summer sea ice in the Arctic.
|
|
#
¿
Nov 19, 2016 03:05
|
|
|
Yeah, Arctic sea ice is over a million kilometers below 2012's (former) record low for this date. However, 2006 had a powerful stall in ice growth - for a couple of weeks, 2006 still has the record low sea ice extent. Consequently, today's record will transition from 2012 record sea ice lows to 2006 record sea ice lows. There it will remain until December 7th, when 2012 record sea ice lows return. I expect both will fall to 2016. Yesterday was a smaller decline, but the sea ice extent still went down. Even if it started to increase today, I don't think it's possible to catch up by the end of December. Evil_Greven fucked around with this message at 16:24 on Nov 20, 2016 |
|
#
¿
Nov 20, 2016 16:20
|
|
|
Things are looking up, a little. I'll caveat that with some potential trends: Cyan is best-case, if the current gain continues until the end of the year - rather unlikely. Green is enhanced growth, realistically the upper bounds of what will probably happen. Yellow range contains the trends from every other year from this point until year end - I think it will fall within this range. Red lower bound would continue on how it has been, realistically the lower bounds of what will probably happen. Fuchsia lower bound would be worst-case - probably won't happen. Evil_Greven fucked around with this message at 04:21 on Nov 22, 2016 |
|
#
¿
Nov 22, 2016 04:15
|
|
|
Arctic sea ice (extent) gained 100,000 sq km on the 20th and almost 200,000 sq km on the 21st, which is good. Sadly, it's still 900,000 sq km below 2006's record low for the 21st, so there's still a ways to go for it to recover. Good news is that it ought to be pretty cold up there for at least a few more days. Five days of this high rate of freezing will meet 2006. By the crossover from 2006 to 2012 record lows on December 7th, sea ice must recover from 8.6 million sq km to 10.75 million sq km; 15 days for 2.15 million sq km, or 144,000 sq km/day. Evil_Greven fucked around with this message at 02:31 on Nov 23, 2016 |
|
#
¿
Nov 23, 2016 02:24
|
|
|
Arctic sea ice (extent) gained another 109,000 sq km yesterday, and 108,000 sq km the day before. The total gain in the last four days has been 516,000 sq km, or 129,000 sq km/day. This is below the 144,000 sq km/day needed to meet the 2006/2012 crossover (and previous record low) on December 7th. If it remains on its current trajectory, it will continue to break the record for the lowest extent until Christmas.
|
|
#
¿
Nov 24, 2016 15:16
|
|
|
loving high tides cause some flooding in Miami area now. That poo poo is just going to get worse and worse. How long are people going to deal with it is anyone's guess. Oh, also, if the Gulf Stream just fizzles... rapid sea rise of feet along along the East Coast will ensue. The current right now pushes water away from the coast. On the Arctic sea ice front, it continues to recover, but it's slower than is needed to hit the December 7th crossover to 2012 record low extent: 9,463,931 sq km total, today. Last few days of recovery have been: +125,669 sq km (Nov 28) +114,379 sq km (Nov 27) +134,391 sq km (Nov 26) +131,954 sq km (Nov 25) +138,895 sq km (Nov 24) Well short of the 144,000 sq km/day needed.
|
|
#
¿
Nov 29, 2016 05:29
|
|
|
One thing I was thinking about recently - with sea levels rising, it ought to further destabilize ice shelves. Ice being buoyant, a rising ocean might lift them ever so slightly away from the land they are bound to, potentially causing rapid breakups. Such an effect is, in my opinion, potentially stronger than the intrusion of warmer water.
|
|
#
¿
Dec 1, 2016 00:05
|
|
|
Don't worry, it's just natural variation. Nothing to be alarmed about. Speaking of - last two days of November each saw a little over 100,000 sq km of growth in Arctic sea ice extent, about 70% of what's needed to catch up by next week. At that point, 2012 becomes the previous low, but the trends greatly suggest that it will become the second lowest to 2016 - for awhile to come. At this point, there's basically no chance of 2016 Arctic sea ice extent catching up to 2012 before Christmas - and it seems unlikely to do so by the end of the year. Oh, and one other thing: remember the 2016 prediction for an ice-free Arctic in the summer? While it was the 'date' cited, the prediction actually came with an error of �3 years (2013 - 2019), and said prediction was for "nearly ice-free." Evil_Greven fucked around with this message at 00:57 on Dec 2, 2016 |
|
#
¿
Dec 2, 2016 00:45
|
|
|
So here are how things are now, and how things ended up in a few previous years if those years were shifted down to the current arctic sea ice area. At this point, I suspect my estimation of 2016 arctic sea ice area ending in the yellow might be too high. Evil_Greven fucked around with this message at 02:57 on Dec 2, 2016 |
|
#
¿
Dec 2, 2016 02:55
|
|
|
Oh. I hadn't noticed that, but you are certainly correct. Fascinating. I suppose the superimposed lines would be curious to see, too:
|
|
#
¿
Dec 2, 2016 05:28
|
|
|
VectorSigma posted:I'll put my chips in the pink triangle. That might be a good bet. +88,180 sq km on December 1st is pretty loving low.
|
|
#
¿
Dec 3, 2016 00:37
|
|
|
Arctic sea ice extent is up from yesterday by +131,901 sq km, which is a lot better than yesterday. It's still too little, though. Some of this seeming variability between one day and the next might be due to the movement of sea ice coinciding with the orbital passes of the satellites, as they look only at narrow portions of the Earth. In other news: quote:A new NASA and university study using NASA satellite data finds that tide gauges -- the longest and highest-quality records of historical ocean water levels -- may have underestimated the amount of global average sea level rise that occurred during the 20th century. Basically, because Greenland is losing mass, the oceans are flowing away from it. This flow away from Greenland mitigates the rise from an increase in sea level dependent upon proximity; closer areas will see less rise, while further away areas will see higher rise. Oh, you might not want to think too much about what might happen Evil_Greven fucked around with this message at 16:03 on Dec 3, 2016 |
|
#
¿
Dec 3, 2016 15:59
|
|
|
Potato Salad posted:What's with the antipodal land rise in the Greenland melt map? These are two different things, though linked by glaciers.
|
|
#
¿
Dec 3, 2016 19:58
|
|
|
Potato Salad posted:Ah - was there an existing event causing Australia to not see rising sea levels already? I am uncertain of the reason for Australia's low sea level rise, but it's a loving weird place.
|
|
#
¿
Dec 4, 2016 01:33
|
|
|
The growth yo-yo continues. Arctic sea ice extent increased by +104, 504 sq km yesterday; two thirds of December 2nd's change, and a fifth higher than the change on December 1st. Here's the area compared to previous year trend and previous year trend if it were offset to start in December of 2016, up through December 2nd:
|
|
#
¿
Dec 4, 2016 15:46
|
|
|
In unsurprising news at this point, Arctic sea ice extent gained a meager 30,631 sq km on December 4th, putting total extent a smidgen over 10 million sq km. I mean hey, it's still rising... but that ain't good: 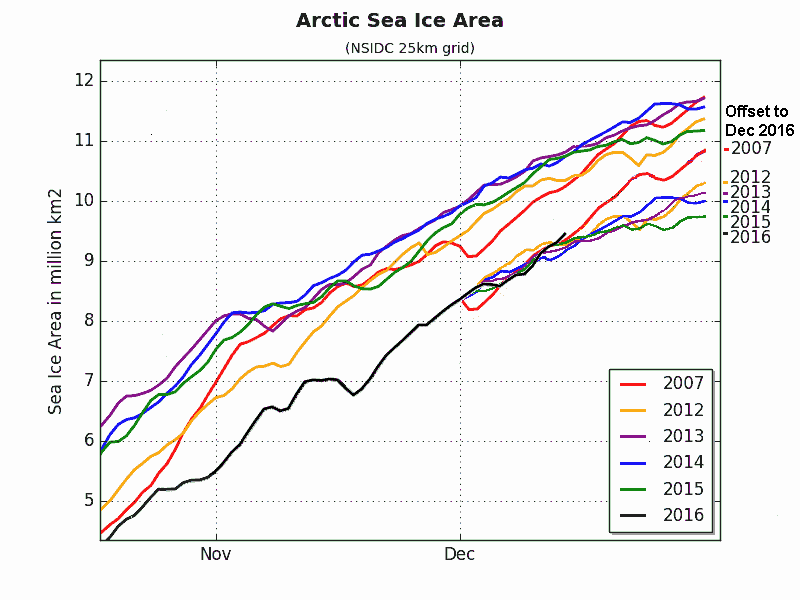
Evil_Greven fucked around with this message at 03:50 on Dec 6, 2016 |
|
#
¿
Dec 6, 2016 00:37
|
|
|
That's fair, I suppose. It's an attempt to show what scenarios might be realistic for the end of the year ice. Oh, and Arctic sea ice area decreased on the 5th of December. Extent barely increased for the same day; under 20,000 sq km. By the way, this graph has been updated - note the inversion of the humps compared to prior years:
|
|
#
¿
Dec 7, 2016 01:17
|
|
|
Just in case, somehow, you were having a good day - here are some things to consider... less certainty but as a thought exercise. You probably know that India and Pakistan don't much like each other. You likely also know that India and Pakistan are nuclear powers. You might also reason that Pakistan is a much less conventionally powerful country than India; its only real power in comparison is nuclear. You might also know that the Indus River flows from China through India into Pakistan, before finally reaching the ocean. You may also know that Pakistan and that area of India rely pretty heavily on the Indus River. You perhaps know that the Indus River is fed by primarily by glaciers in the Himalayas. You may have heard that these glaciers are melting, which will diminish the flow of the Indus River. So, what do you suppose might happen when the Indus River provides less water? In other news, Arctic sea ice extent and area are both up for December 6th. Less than +40,000 sq km for extent, though.
|
|
#
¿
Dec 7, 2016 23:09
|
|
|
I'm increasingly wondering if 2017 might be the first year that Arctic ice is mostly MIA during the summer. To be fair, December through March is the depths of winter, so it might recover. Thing is, there's this thing called Freezing Degree Days. It's calculated not by singular days that are below freezing, but by temperature below freezing multiplied by days; a day of -4C is thus 4 FDD (technically, seawater freezes at a lower temperature, so it's really -5.8C = 4 FDD). FDD is thought to coincide well with sea ice growth... and 2016's freezing season is rather lacking in them: Evil_Greven fucked around with this message at 05:14 on Dec 8, 2016 |
|
#
¿
Dec 8, 2016 04:54
|
|
|
Telephones posted:So it seems like stopping climate change or really even controlling the effects is no longer possible unless we were to almost entirely stop emissions within the next few years - right? How does a rapid +0.5C on top of the already way the gently caress higher temperatures now sound? Incidentally, Arctic ice extent increase for December 8th was +72,505 sq km, more than 20k lower increase than the 7th... things are looking uhh... (refresher - the duplicate lines are previous years' December trends offset to start at the beginning of December 2016): Evil_Greven fucked around with this message at 01:59 on Dec 10, 2016 |
|
#
¿
Dec 10, 2016 01:56
|
|
|
Oil Nazis. It has an interesting ring. e: also - this is neat: quote:For each tonne of Carbon Dioxide (CO2) that any person on our planet emits, three square metres of Arctic summer sea ice disappear. Evil_Greven fucked around with this message at 02:06 on Dec 10, 2016 |
|
#
¿
Dec 10, 2016 02:00
|
|
|
Speaking of, it looks like the Northeast will be drowning in cold. https://twitter.com/capitalweather/status/807287858298032128 Also here where I live on the outskirts of it. It's drat cold. loving climate change shoving the Arctic down here. Collectively we deserve it, but it fuels American skepticism something fierce. Thanks Nature.
|
|
#
¿
Dec 10, 2016 03:58
|
|
|
Hollismason posted:So is this going to be more common? Like could it shift permanently? Or just be incredibly more frequent? The thought is that a warming Arctic displaces the cold - the polar vortex - to another location. A little while back, that was Siberia. It then moved through Alaska and Canada into the lower 48 states. It's also thought that it could shift more towards hanging around in Europe.
|
|
#
¿
Dec 10, 2016 17:07
|
|
|
In good news, Arctic sea ice extent rose 207,700 sq km yesterday. The Bering Strait finally closed to block the Chukchi Sea. In bad news, it's still over half a million sq km below the previous record low. Still, things are looking a little better from the extent perspective.
|
|
#
¿
Dec 11, 2016 15:44
|
|
|
Arctic sea ice extent is up about +115,000 sq km for December 14th, still far too low. Better than the +42,599 sq km the previous day and the little over +100,000 sq km the day before. Not nearly as good as the +178,178 sq km on December 10th. I still don't see it meeting even the previous record low 2012 extent before the end of the year, though. Remember that extent is different than area; for Area, 2015 was the lowest at the end of the year. An update on the Arctic sea ice area chart - positive news on recovery - do note that it is nowhere near equal to even the lowest end of the year (2015), but the trend has been quite good:
Evil_Greven fucked around with this message at 05:24 on Dec 15, 2016 |
|
#
¿
Dec 15, 2016 05:18
|
|
|
Arctic sea ice extent was up less than +85,000 sq km for December 15th. Pretty sad... https://twitter.com/zlabe/status/809794646683492352 Also, at this point, most of this year has been the record lowest Arctic ice extent.
|
|
#
¿
Dec 17, 2016 03:05
|
|
|
blowfish posted:This makes sense - conservation type things should make for great conservative issues because they often boil down to protecting the status quo from unwanted change and/or putting things back to how they were in the past. It's literally in the name. That's perhaps one reason why they're still so invested in saying it isn't happening, or that it isn't our fault.
|
|
#
¿
Dec 17, 2016 18:26
|
|
|
Things are looking up...quote:Scientists at institutions in the United States and Australia on Friday published a set of unprecedented ocean observations near the largest glacier of the largest ice sheet in the world: Totten glacier, East Antarctica. And the result was a troubling confirmation of what scientists already feared - Totten is melting from below. quote:These waters, the paper asserts, are causing the ice shelf to lose between 63 and 80 billion tons of its mass to the ocean per year, and to lose about 10 meters (32 feet) of thickness annually, a reduction that has been previously noted based on satellite measurements.  Oh, also I guess there's the Arctic sea ice death spiral... Evil_Greven fucked around with this message at 06:39 on Dec 18, 2016 |
|
#
¿
Dec 18, 2016 06:31
|
|
|
The British are coming!quote:Britain is preparing to move its research station in the Antarctic 23km further inland because it is under threat from a growing crack in the ice. The perspective coming out of IJIS is not great. Arctic sea ice extent was up +87,489 sq km for December 20th, +64,298 sq km on the 19th and +44,312 km sq km on the 18th. A day lapse in observations from the 16th in conjunction with the 17th averaged a bit under +80,000 sq km for each day, which is close to the +82,554 sq km on the 15th; this completes the series since I last checked. I say not great because the big driver of increase has now ceased being so - Hudson Bay is basically done, and it went fast. Oh, and here's how area looks with our projection thresholds - better, but the decrease in growth could be a problem: Evil_Greven fucked around with this message at 05:58 on Dec 21, 2016 |
|
#
¿
Dec 21, 2016 05:50
|
|
|
NOAA finally released their November report (or I finally refreshed the tab):quote:The combined average temperature over global land and ocean surfaces for November 2016 was the fifth highest for November in the 137-year period of record, at 0.73�C (1.31�F) above the 20th century average of 12.9�C (55.2�F). This value is 0.23�C (0.41�F) cooler than the record warmth of 2015 but 0.05�C (0.09�F) higher than the average November value for the 21st century to-date (2001�2016). This was substantially less than previous months; October was tied for 3rd highest and September was a solid 2nd highest. However, here's a rather concerning thing: quote:The average global temperature across land surfaces was 0.95�C (1.71�F) above the 20th century average of 5.9�C (42.6�F)�the 12th highest November global land temperature on record. quote:For the oceans, the November globally-averaged sea surface temperature was 0.65�C (1.17�F) above the 20th century average of 15.8�C (60.4�F), the second highest for November on record, but considerably lower than the record high of 2015 by 0.19�C (0.34�F). They put a link in there comparing 2016 with past years in some anticipation of a record or near-record year, which has this: quote:If December matches the 1998 monthly values (represented by the black triangles): 2016 would tie with 2015 as the warmest year on record.
|
|
#
¿
Dec 23, 2016 18:24
|
|
|
Even in winter, Arctic sea ice is no longer safe: https://twitter.com/ZLabe/status/812142879644745728
|
|
#
¿
Dec 24, 2016 07:56
|
|
|
Arctic sea ice extent has been virtually static for the last few days, and was at 11,401,745 km sq km for Christmas Eve. On the 21st of December, it was at 11,401,398 sq km. It then fell the next day to 11,400,739 sq km, and since then it's barely changed.  Merry loving Christmas. Evil_Greven fucked around with this message at 21:25 on Dec 29, 2016 |
|
#
¿
Dec 25, 2016 15:34
|
|
|

|
| # ¿ May 15, 2024 03:37 |
|
|
The Arctic sea ice is growing again after a few days of pause, and it's up 104,870 sq km. However, it's still several hundred thousand sq km below the previous lowest record. Consequently, this is what things are looking like as we near the end of the year for area:
|
|
#
¿
Dec 26, 2016 16:57
|
|