|
This is violence.
|
 #
?
Oct 27, 2016 13:22
#
?
Oct 27, 2016 13:22
|
|


|

|
| # ? May 24, 2024 15:29 |
|
|
The most beautiful thing I have seen. Time to go troll on Facebook.
|
|
#
?
Oct 27, 2016 13:25
|
|


|
They�re all good, but this one is a 
|
|
#
?
Oct 27, 2016 13:25
|
|

|
Platystemon posted:They�re all good, but this one is a The multiply logarithmic scale on the Y is just beautiful. 
|
|
#
?
Oct 27, 2016 13:44
|
|


|
That's just base 10 logarithmic though?
|
|
#
?
Oct 27, 2016 14:09
|
|

|
Fathis Munk posted:That's just base 10 logarithmic though? Yeah, there's nothing unusual about it. But most people don't understand logarithmic scales.
|
|
#
?
Oct 27, 2016 14:18
|
|
|
The great thing is that it is just a normal scale and all of the data is displayed correctly, only the scale is not suited to this kind of data at all. Once more the graph is technically correct. But completely unusable.
|
|
#
?
Oct 27, 2016 14:29
|
|
|
|
|
#
?
Oct 27, 2016 14:34
|
|


|
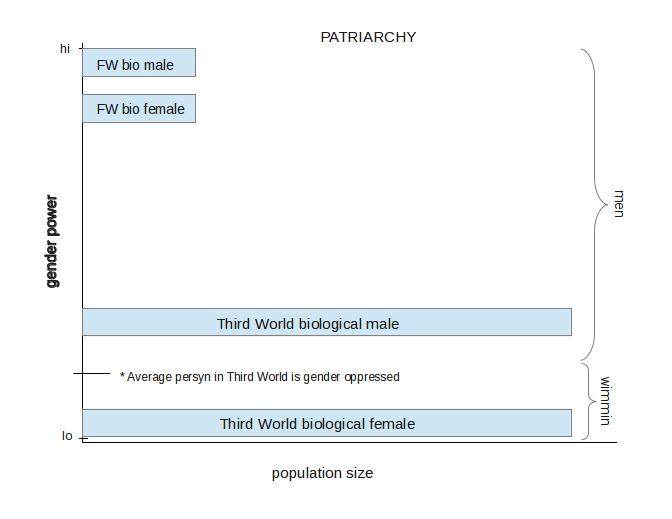
lmao is this trying to say that women in developed countries are actually men in the global system of patriarchy?
|
|
#
?
Oct 27, 2016 14:41
|
|

|
hi gender power
|
|
#
?
Oct 27, 2016 14:48
|
|


|
Persyn? Did Ulillillia make this graph?
|
|
#
?
Oct 27, 2016 15:50
|
|

|
I was learning how to graph using some new software.  
|
|
#
?
Oct 27, 2016 15:55
|
|


|
Fathis Munk posted:The great thing is that it is just a normal scale and all of the data is displayed correctly, only the scale is not suited to this kind of data at all. The point of the graph is to compare values that are close to each other from 1 to 1946. What scale would you have used?
|
|
#
?
Oct 27, 2016 15:59
|
|

|
WrenP-Complete posted:I was learning how to graph using some new software. this is me
|
|
#
?
Oct 27, 2016 16:52
|
|

|
These are all great, but this one is masterful. e: Beaten, and almost verbatim too...
|
|
#
?
Oct 27, 2016 16:55
|
|

 Yes, it's like a lava lamp.
|
Bukowski posted:The point of the graph is to compare values that are close to each other from 1 to 1946. What scale would you have used? I uh... Hm.
|
|
#
?
Oct 27, 2016 17:16
|
|
|
Bukowski posted:The point of the graph is to compare values that are close to each other from 1 to 1946. What scale would you have used? 
|
|
#
?
Oct 27, 2016 17:47
|
|
|
flosofl posted:Yeah, there's nothing unusual about it. But most people don't understand logarithmic scales. Sneaking a 0 on the y axis (where it should be 10^-1) is cheating though.
|
|
#
?
Oct 28, 2016 04:36
|
|
|
A brief history of Earth;
|
|
#
?
Oct 28, 2016 18:38
|
|


|
I wish to know more about this "hyper-war"
|
|
#
?
Oct 28, 2016 18:42
|
|
|
LostCosmonaut posted:A brief history of Earth; We now know the points in time in which the evil time travelers traveled back to help ensure their ascension to dominance.
|
|
#
?
Oct 28, 2016 18:44
|
|

|
Man you learn something new every day.
|
|
#
?
Oct 28, 2016 18:46
|
|
|
flosofl posted:I wish to know more about this "hyper-war" I'm not sure why it's labeled a decrease in scientific advancement considering it apparently led to the invention of pie.
|
|
#
?
Oct 28, 2016 18:57
|
|

|
LostCosmonaut posted:A brief history of Earth; RISE OF THE PIE PEOPLE 
|
|
#
?
Oct 28, 2016 19:05
|
|


|
LostCosmonaut posted:A brief history of Earth; Lol, as if a society several times more advanced that our own wouldn't have a bunch of satellites and poo poo still careening around in orbit, much less laugh at the destruction of their home planet as they terraform Mars or some poo poo
|
|
#
?
Oct 28, 2016 19:18
|
|


|
Well where do you think the martians come from 
|
|
#
?
Oct 28, 2016 19:25
|
|
|
Outrail posted:Lol, as if a society several times more advanced that our own wouldn't have a bunch of satellites and poo poo still careening around in orbit, much less laugh at the destruction of their home planet as they terraform Mars or some poo poo It's a joke graph that makes fun of the original "hole left by Christian dark ages" chart that you can barely make out there in the corner.
|
|
#
?
Oct 28, 2016 19:25
|
|


|
steinrokkan posted:It's a joke graph that makes fun of the original "hole left by Christian dark ages" chart that you can barely make out there in the corner. Yes, the Korean Hyper-war tipped me off. But it doesn't even make sense within it's own reality was my point.
|
|
#
?
Oct 28, 2016 19:45
|
|
|
Horses cannot talk, and probably would not be allowed in bars for fire safety reasons. Be serious.
|
|
#
?
Oct 28, 2016 20:31
|
|

|
The lack of fossilized remains of advanced ancient civilizations, archaic orbital debris, and remnants of the intergalactic empire attempting to contact their Terra Prime means that this is a thoroughly debunked fraud that fails to highlight the individual initiative that Hillary Clinton has put forward to securing the presidency. Politifact rates this graph: MOSTLY FALSE
|
|
#
?
Oct 28, 2016 21:07
|
|

|
LostCosmonaut posted:A brief history of Earth; Finally, an expansion of my all time favorite "history" graph! 
|
|
#
?
Oct 28, 2016 22:01
|
|
|
Lt. Danger posted:Horses cannot talk, and probably would not be allowed in bars for fire safety reasons. Be serious. Are horses flammable or why would they be a fire hazard?
|
|
#
?
Oct 28, 2016 22:53
|
|


|
perkele
|
|
#
?
Oct 28, 2016 23:23
|
|
|
lifg posted:Finally, an expansion of my all time favorite "history" graph! I know there's a lot to hate about this graph, but my favorite (obviously) is how it ignores the surviving Eastern Empire.
|
|
#
?
Oct 29, 2016 02:13
|
|

|
 And the Greater Korean Empire, for posterity.
|
|
#
?
Oct 29, 2016 02:24
|
|


|
dijon du jour posted:I'm not sure why it's labeled a decrease in scientific advancement considering it apparently led to the invention of pie. I know you're joking, but for anyone who didn't know PIE means Proto Indo European. It's the culture that spoke the language that's the common ancestor of Latin, German, Gaelic, and Sanskrit. https://en.m.wikipedia.org/wiki/Proto-Indo-European_language
|
|
#
?
Oct 29, 2016 02:51
|
|


|
vyelkin posted:And here are some of the other amazing graphs from that thread, mostly from forums user NotJesus: That y-axis is literally amazing.
|
|
#
?
Oct 29, 2016 07:29
|
|

|
lifg posted:Finally, an expansion of my all time favorite "history" graph! Where did they find this beautifully preserved graph from the 16th century
|
|
#
?
Oct 29, 2016 11:09
|
|


|
Not Operator posted:That y-axis is literally amazing. Well, it's really only a bog-standard logarithmic scale, the amazing thing is coming up with the idea of using a log scale for this purpose. Which is hilariously inappropriate even if technically correct (the actual number of Hitler's balls is strictly speaking contested, mind you).
|
|
#
?
Oct 29, 2016 12:51
|
|
|

|
| # ? May 24, 2024 15:29 |
|
|
Byzantine posted:I know there's a lot to hate about this graph, but my favorite (obviously) is how it ignores the surviving Eastern Empire. People are using lowercase letters while they say the Middle Ages brought nothing new. smdh
|
|
#
?
Oct 29, 2016 13:49
|
|