


|
Dave Grool posted:Same and also Matlab like 2 years ago ioGAS makes similar graphs if you select too many elements Then your geochemist will just go "yep, looks good" and include it in their report Content: 
Memento has a new favorite as of 07:53 on May 4, 2020 |
 #
?
May 3, 2020 02:18
#
?
May 3, 2020 02:18
|
|


|

|
| # ? Jun 1, 2024 20:52 |
|
|
double post so what "lol which fuckhead is using a pie chart to show GDP decline" the Prime Minister of Australia
|
|
#
?
May 5, 2020 05:35
|
|
|
Not even 3D, how are we supposed to tell whether the pie is getting higher or not
|
|
#
?
May 5, 2020 07:34
|
|
|
https://twitter.com/NateSilver538/status/1257477043970887682
|
|
#
?
May 5, 2020 10:44
|
|

|
uhhhh obviously the white house is an adherent of TIMECUBE
|
|
|
#
?
May 5, 2020 10:59
|
|
|
Found this great model gore in the replies https://mobile.twitter.com/lpachter/status/1254692980004274176
|
|
#
?
May 5, 2020 11:00
|
|

|
The Something Awful Forums > Main > Post Your Favorite (or Request): To post is human; to list, divine. > PYF awful/funny graphs and charts: HE FIT A SIXTH ORDER POLYNOMIAL TO THE DATA
|
|
#
?
May 5, 2020 11:02
|
|
|
"You! Unpaid lackey #17. You have an important mission. This is from THE VERY TOP!" "Yes sir, what would you like me to do?" "Here's a spreadsheet. Click buttons, make number go down."
|
|
#
?
May 5, 2020 11:36
|
|


|
It's even worse than that it wants to be taken seriously https://twitter.com/ericuman/status/1257645771794644992
|
|
#
?
May 5, 2020 13:25
|
|
|
Memento posted:It's even worse than that Nobody is talking about how the deaths go negative after the 15th. We are not prepared for the return of the living dead.
|
|
#
?
May 5, 2020 13:30
|
|
|
Stoatbringer posted:"You! Unpaid lackey #17. You have an important mission. This is from THE VERY TOP!" Kevin Hassett is not an unpaid lackey, he is a professional clown whose entire career is abusing the data to make the numbers go up or down as needed.
|
|
#
?
May 5, 2020 13:30
|
|
|
jjack229 posted:Nobody is talking about how the deaths go negative after the 15th. We are not prepared for the return of the living dead. Someone get Bruce Campbell on the line, we're going to need him for this one
|
|
#
?
May 5, 2020 13:41
|
|
|
The periodicity of that data is amazing. Are people not dying of Coronavirus on the weekend?
|
|
#
?
May 5, 2020 15:23
|
|

 Yes, it's like a lava lamp.
|
PittTheElder posted:The periodicity of that data is amazing. Are people not dying of Coronavirus on the weekend? Deaths aren't reported nearly as much in the weekend, weekend deaths get bunched up with Monday's or Tuesday's data.
|
|
#
?
May 5, 2020 15:25
|
|

|
Carbon dioxide posted:Deaths aren't reported nearly as much in the weekend, weekend deaths get bunched up with Monday's or Tuesday's data. This is why whenever there's a report of a record high deaths/cases in a day you should probably disregard. The data is so noisy that spikes like that are just that. Best to look at some multi-day average to get a clearer picture. I was looking at historical data for deaths in the UK a few weeks ago. I was wondering what happened in one year where there was this huge spike in deaths in early January, and most of the years had an elevated number at this time. Family stress getting to people? Overeating and drinking? Despair at having to go back to work? Or just x-mas vacation means spotty hours for labs so the data just gets pushed to the next week.
|
|
#
?
May 5, 2020 17:32
|
|

|
Every week you also hear how the deaths were down (on the weekend) so everything is ok now
|
|
#
?
May 5, 2020 17:39
|
|

|
That name seems familiar
|
|
#
?
May 5, 2020 19:06
|
|

|
Watermelon Daiquiri posted:uhhhh obviously the white house is an adherent of TIMECUBE Calling it: Gene Ray predicted COVID-19. The medical community was EDUCATED STUPID. It�s DEADLY ERRONEOUS to not consider four 24-hour day rotations when calculating mortality rates - when you do, the numbers are much more complimentary to Trump.
|
|
#
?
May 5, 2020 19:12
|
|
|
Dr. Arbitrary posted:That name seems familiar I also like how the Laffer Curve is so helpfully labeled.
|
|
#
?
May 5, 2020 19:19
|
|


|
change the corporate tax rate to the effective tax rate, Laffer, I dare you
|
|
#
?
May 5, 2020 19:26
|
|


|
I once talked to a young conservative who was so convinced by the Laffer curve that he thought that a 25% maximum tax rate was hard-wired into the human mind lol
|
|
#
?
May 5, 2020 19:53
|
|


|
Dr. Arbitrary posted:That name seems familiar
|
|
#
?
May 5, 2020 20:01
|
|

|
|
|
#
?
May 5, 2020 20:17
|
|

|

|
|
#
?
May 8, 2020 17:06
|
|

|
Is this what happens when someone draws a spectrum as a Venn diagram? Or is it something else?
|
|
#
?
May 8, 2020 17:57
|
|
|
jjack229 posted:Is this what happens when someone draws a spectrum as a Venn diagram? Or is it something else? It's when you're told you need a graphic to drive clicks and you just take the least amount of effort. Taken from this article.
|
|
#
?
May 8, 2020 17:59
|
|
|
Are you sure it's not stolen from Sebastian "the Dragon of Budapest" Gorka's doctoral thesis?
|
|
#
?
May 8, 2020 18:14
|
|
|

|
|
#
?
May 8, 2020 19:47
|
|


|
Two things that don�t overlap at all, but the enabling media manufactures a gray area.
|
|
#
?
May 8, 2020 22:31
|
|
|

|
|
#
?
May 9, 2020 00:42
|
|

|

|
|
#
?
May 9, 2020 00:52
|
|
|
lol
|
|
#
?
May 9, 2020 03:56
|
|


|
lmao
|
|
#
?
May 9, 2020 03:57
|
|

|
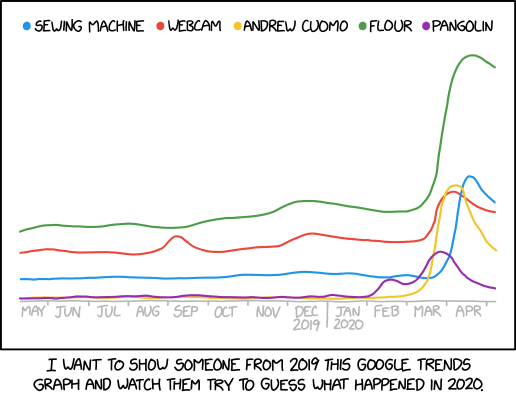
what happened in september of 2019 though
|
|
#
?
May 9, 2020 04:00
|
|

|
Excellent text selection to make that one readily discernable, bravo.
|
|
#
?
May 9, 2020 04:00
|
|


|
Zvahl posted:what happened in september of 2019 though Fresh crop of college students needing webcams maybe?
|
|
#
?
May 9, 2020 04:08
|
|


|
jennicam anniversary
|
|
#
?
May 9, 2020 04:15
|
|
|
New thread title please.
|
|
#
?
May 9, 2020 04:43
|
|

|
taqueso posted:jennicam anniversary oh man that brings me back.
|
|
#
?
May 9, 2020 05:49
|
|
|

|
| # ? Jun 1, 2024 20:52 |
|
|
https://twitter.com/jackmirkinson/status/1259546236551663616 https://www.youtube.com/watch?v=aZJze_TQaDE
|
|
#
?
May 10, 2020 22:18
|
|