


|
Here's something simple and minimalist that might be simultaneously the worst stacked bar char t I've ever seen. It's supposed to be showing the minimum and average frames per second, look at it for a moment and let it sink in what they did. I'm crosspostig it from this thread here: http://forums.somethingawful.com/showthread.php?noseen=0&threadid=3348051&perpage=40&pagenumber=216#post454067634 The labels are correct but they just directly stacked the min and avg values so the total bar size is min+avg, so the only thing that still makes sense is that more is still better, but otherwise it's completely useless. Of course it would've been perfectly readable too if the segment sizes were min and avg-min (while retaining the labels).  Oh look, suddenly you can tell at a glance that the stock Pentium has a higher average but lower minimum than the AMD processor.
|
 #
¿
Dec 20, 2015 16:38
#
¿
Dec 20, 2015 16:38
|
|


|

|
| # ¿ May 11, 2024 19:13 |
|
|
That's because you're looking at it wrong. It's actually 17+23 = 40 > 38 So it makes sense! When I said the labels are correct, keep in mind that the labels are for the segments separately. Which would make sense if these were daily apple and pear sales, I guess.
|
|
#
¿
Dec 21, 2015 00:49
|
|
|
Solice Kirsk posted:Also our baking measurements are better anyways since it doesn't have to be standardized and just rely on the correct proportions of ingredients and you wind up with the correct end product. Cups and spoons are bullshit for baking though, it really has to be by mass to get any sort of decent repeatability and consistency.
|
|
#
¿
Jan 4, 2016 02:28
|
|
|
Well, I'm glad I made it through my main wall-punching years without actually punching any.
|
|
#
¿
Jan 18, 2016 01:05
|
|

|
Aaaaaaaa
|
|
#
¿
Feb 7, 2016 22:03
|
|
|
Jesus christ shut the gently caress up about US elections already.
|
|
#
¿
Feb 11, 2016 22:15
|
|
|
Aramoro posted:As a company in a Gartner Magic Quadrant that's not actually that bad a chart, they make worse, far far worse. Which you then have to try and interpret the results of so you can end up in the right Quadrant next time.  Strudel Man posted:Business people don't use data.
|
|
#
¿
Feb 16, 2016 20:57
|
|
|
Tree Goat posted:What's wrong with Tableau? Nothing, really, I'm just mad we're not in the top right corner where we rightfully belong.
|
|
#
¿
Feb 16, 2016 21:58
|
|
|
Ok some content for a change:
|
|
#
¿
Feb 17, 2016 19:36
|
|
|
|
|
#
¿
Feb 26, 2016 14:47
|
|
|
Ok, because for a moment I was worried this was becoming the "guess the unlabeled map" thread now that D&D frowns upon such things.
|
|
#
¿
Mar 5, 2016 22:23
|
|
|
Christo posted:With the added bonus of there actually already being an international men's day, November 19th. It's almost like these guys don't actually care about men's issues unless it's to argue with feminists. Maybe they just wanted to find out when the Men's Day was, because I certainly didn't know.
|
|
#
¿
Mar 8, 2016 15:58
|
|
|
Mikl posted:Sweden? What the hell? Assange was very busy during the period.
|
|
#
¿
Mar 9, 2016 01:23
|
|

|
Yeah it's clearly not intended to go into negative values 
|
|
#
¿
Mar 19, 2016 17:11
|
|
|
Fathis Munk posted:What? Is it that uncommon of a thing Just knock on the table like the Germans do.
|
|
#
¿
Apr 6, 2016 19:36
|
|

|
Holy poo poo I just found another one in yospos:  Edit: It's from this book apparently, pages 99-102, if anyone wants to waste some time: https://www.google.com/url?url=http...e6vBSpeJY3Uwo3Q (PDF warning). The "Destination" from the sign is on p 119, but it's not very funny. mobby_6kl has a new favorite as of 23:55 on Jun 9, 2016 |
|
#
¿
Jun 9, 2016 18:23
|
|
|
This is pretty mild compared to some other poo poo here, but c'mon:
|
|
#
¿
Jul 2, 2016 00:04
|
|
|
Oxyclean posted:I guess it being about G8 Countries would make it weird if they left one out? I suppose they could have an asterix note? Russia shouldn't even be included in G8 anyway
|
|
#
¿
Jul 5, 2016 16:34
|
|
|
kalstrams posted:On an unrelated note, Puerto Rico uses kilometres for distance, whilst using miles per hour for speed limits. Don't they also drive on the wrong side of the road? Brilliant stuff.
|
|
#
¿
Jul 13, 2016 17:34
|
|
|
If anyone knows where to get De Niro's compensation by film (other than googling one by one), I'll make a chart as bad as this thread deserves.
|
|
#
¿
Jul 27, 2016 19:27
|
|
|
^^^ That one is pretty amazing in how you discover all the atrocities in waves. Though really it's probably some poor gently caress forgetting to change the secondary axis, otherwise it would've been just bad in mostly unremarkable way (except for August). Then there's this one, it seems that Fox News tactics are spreading in the wild: 
|
|
#
¿
Aug 8, 2016 19:13
|
|
|
zakharov posted:India's number 1 sport by a mile is cricket, which is not in the Olympics. If anything, it's India's number 2 sport that I would look out for.
|
|
#
¿
Aug 22, 2016 23:51
|
|
|
Not really a graph but I think this belongs here:  It's a speed limit sign for Poland. I guess it's pretty logically laid out, but consider that you'll only get to see it once when driving through the border at a decent speed. In contrast, here's the German one: 
|
|
#
¿
Aug 27, 2016 11:10
|
|
|
flosofl posted:Maybe it's because I'm not from Europe, but I see nothing logical about this at all for a sign you need to take in while having only seconds to register it. It took at least a minutes to figure out *most* of it. Some are guesses I'm pretty confident, some are guesses I'm not, and there's still a couple I have no loving clue. The German one, on the other hand is perfectly clear of course. Although it has been simplified to basically only show passenger cars - trucks and buses also have different limits, but the assumption is probably that professional drivers can be expected to research this poo poo on their own.
|
|
#
¿
Aug 28, 2016 01:49
|
|
|
Powered Descent posted:Clearly the maker of the graph has an all-terrier motive. Tree Goat posted:Are there any other examples of treemaps in the wild (where "the wild" is "the news media or clickbait or infographics")? I know the wikipedia import/export graphs use treemaps, and there's the map of the market, and some disk space analysis software, but all of those applications are sort of for wonks anyway. I am trying to think of where the general public would see a fair number of hierarchical quantities where a bar chart wouldn't be a better option.
|
|
#
¿
Aug 28, 2016 20:11
|
|
|
I could see some use cases where l/100km is a bit less intuitive than MPG/MPL but comparing different cars is definitely not one of them. In fact, it's a much better way to compare cars because you can exactly see how much more or less fuel a car uses. E.g, 10l/100km car will use 2 fewer liters than 12l/100km, exactly the same as going from 7 to 5l/100km, which is far less obvious with the inverse nature of MPG. And the scale itself is extremely simple too: <5 is good, ~7 is ok, >10 is bad, at least as far as a regular joe motorist is concerned, though it would vary with fuel type and vehicle class.
|
|
#
¿
Sep 25, 2016 17:16
|
|
|
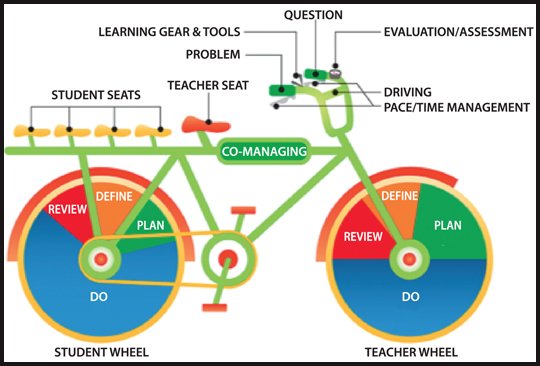
Snowglobe of Doom posted:I heard that unicorns have good mileage but aren't really suitable for city driving, c/d? The Cheshire Cat posted:I feel like including a graph this stupid in a website for a tutoring service would actually serve to drive people away from said service. I mean if they don't know how graphs work how would anyone expect them to teach kids how to do it?
|
|
#
¿
Sep 26, 2016 23:41
|
|
|
The Cheshire Cat posted:I like the extra touch that it's not just a straight line. That's how you know it's real data. Of course, some fraud is worse more Billions of Dollars than other fraud
|
|
#
¿
Oct 24, 2016 19:57
|
|
|
Well, clearly, I have severe dehydration now after looking at this chart.
|
|
#
¿
Oct 25, 2016 11:34
|
|

|
Foxhound posted:Why, are you in a coma or dead? Yep, just woke up. Doctors said it could take years but I was lucky I guess.
|
|
#
¿
Oct 26, 2016 22:56
|
|
|
sweeperbravo posted:Please tell me about yard sard  There's not much to it.
|
|
#
¿
Nov 1, 2016 23:19
|
|
|
Maybe it's Jeff Waters? He's a loving beast. More importantly though, how did they come up with the Israel's number? I thought they were still not acknowledging having any officially.
|
|
#
¿
Jan 4, 2017 00:29
|
|
|
Aschlafly posted:Are you sure? This graph shows him getting a lot of first- and last-place rankings and not much else.
|
|
#
¿
Feb 6, 2017 19:50
|
|
|
They just mixed up the colors in the legend, otherwise everything is correct
|
|
#
¿
Feb 11, 2017 22:11
|
|
|
Count Roland posted:This brought back a memory from my adolescence, where a friend and I were wondering what the decimal point meant. We figured 1 was a death, and the decimals were degrees of injured. It's probably just using a hardcoded printf format for all numeric data like "%.1f"  Anyway I always preferred this scene myself even though it makes about as much sense: 
|
|
#
¿
Feb 14, 2017 10:37
|
|
|
FrozenVent posted:What hath man wrought? You have no idea. mobby_6kl posted:Nope, Schwetzingen. Should've known better in a small town but there's a pretty good Indian and Mexican places so that was bummer.
|
|
#
¿
Mar 6, 2017 19:06
|
|


|
It looks like a 3d shape so maybe what we're looking at here isn't a perfect sphere, and the highlighted part does make up 30% of the volume
|
|
#
¿
Mar 28, 2017 22:23
|
|
|
^^^ No I think that's why it's a separate measure - like that band you haven't even heard of is very cool. Phlegmish posted:I also think it's bizarre for Vice to do so poorly. Did they just not know what it was? Well yeah, that too, as it's fairly low on the y-axis as well. But I would guess that they'd do the rankings just among the people who do know the brand. They should do this with B2B brands and have them estimate coolness based on names/logos. mobby_6kl has a new favorite as of 09:04 on Apr 4, 2017 |
|
#
¿
Apr 4, 2017 08:43
|
|
|
Antti posted:So the bars are a probability distribution of the total points at the end of the season, and the cumulative percentage is the odds of being in the top 4 when Arsenal has the amount of points indicated for that bar?
|
|
#
¿
Apr 13, 2017 11:08
|
|
|

|
| # ¿ May 11, 2024 19:13 |
|
|
steinrokkan posted:
|
|
#
¿
Apr 15, 2017 01:23
|
|
