


|
For fun, here's some old info that I stumbled upon this weekend regarding climate change: White House Memo 17 September 1969 President's Science Advisory Committee report, 1965 The first led me to the second, which has a bunch of neat info like projecting 25% increase in CO2 levels by 2000 (from 1950 baseline) and a corresponding increase of 0.6�C to 4.0�C at the surface... actual increase was a bit over 32% and right at 0.6�C. Nixon hosed us again. Well, him and LBJ. Evil_Greven fucked around with this message at 02:24 on Nov 8, 2015 |
 #
¿
Nov 8, 2015 02:22
#
¿
Nov 8, 2015 02:22
|
|


|

|
| # ¿ Apr 29, 2024 07:47 |
|
|
That Bloomberg article (where those graphics came from) owns. If for some reason you want to challenge shitheads who still call this a scam or some poo poo, point out some historic things, such as: 1884 - "carbonic acid" (aka CO2) recognized as a greenhouse gas (though that specific term had yet to be fleshed out). 1909 - greenhouse gas originates 1950 - CO2 levels measured 1965 - President Lyndon B. Johnson says this to Congress: quote:This generation has altered the composition of the atmosphere on a global scale through radioactive materials and a steady increase in carbon dioxide from the burning of fossil fuels. 1965 - President's Science Advisory Committee report: quote:Based on projected world energy requirements, the United Nations Department of Economic and Social Affairs (1956) has estimated an amount of fossil fuel combustion by the year 2000 that with our assumed partitions would give about a 25 percent increase in atmospheric CO2, compared to the amount present during the the 19th Century. As nobody did a loving thing since then, the actual recorded concentration for 1999 was a bit over 368ppm. Evil_Greven fucked around with this message at 02:45 on Nov 13, 2015 |
|
#
¿
Nov 13, 2015 02:34
|
|
|
I figure we deserve something to be thankful for...quote:If you thought last month seemed unusually hot for October, you weren�t imagining things. Globally, it was the hottest October on record, according to information released on Nov. 18 by NASA and the US National Oceanic and Atmospheric Administration (NOAA). It was also the greatest above-average departure from the average for any month.
|
|
#
¿
Nov 23, 2015 05:55
|
|
|
That depends on a few things, too. Honda calculated that the non-driving cost of a vehicle in CO2 was 22% of what it emitted over a lifetime of 100,000 miles. That would be a combined production, disposal, transportation, resource extraction, etc. That came out to roughly 2.22 tons of CO2. Suppose someone only drives a lovely MPG car about 5000mi/yr and suddenly upgrading to a great MPG car doesn't seem like a great option from a 'green' standpoint. However, it might be far more. There's a (perhaps high-end) estimate of 35 CO2-equivalent tons for a new Land Rover. Evil_Greven fucked around with this message at 00:54 on Dec 2, 2015 |
|
#
¿
Dec 2, 2015 00:52
|
|
|
In other news, the Arctic is going to go above freezing for awhile... in winter:quote:Warm Arctic Storm To Hurl Hurricane Force Winds at UK and Iceland, Push Temps to 72+ Degrees (F) Above Normal at North Pole This weekend was pretty crazy, but holy poo poo. Also, the cold air has to go somewhere... the U.S. gets some of it! Take a look at stuff right now. Evil_Greven fucked around with this message at 01:57 on Dec 29, 2015 |
|
#
¿
Dec 29, 2015 01:48
|
|
|
As expected...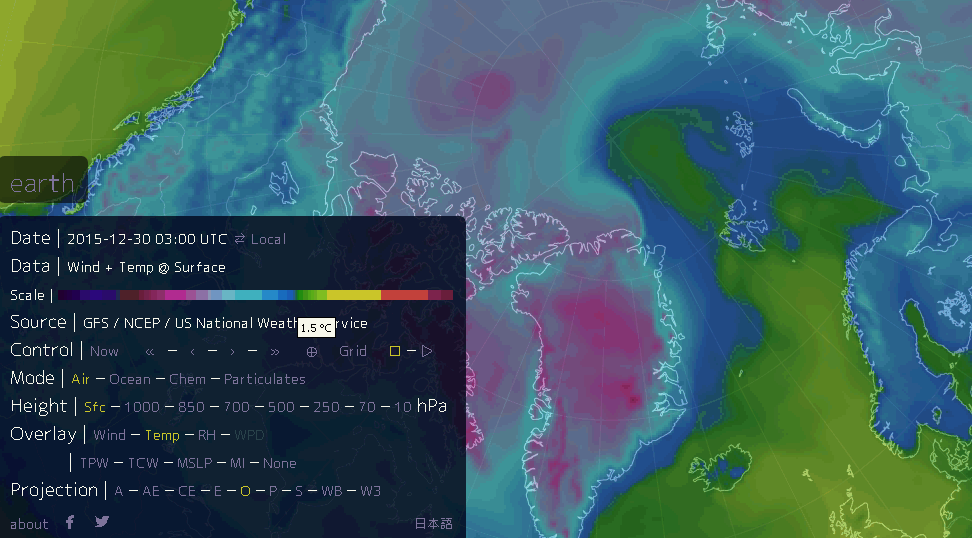 ...for a brief time period, anyway. It's loving Winter. It is pitch dark there, now.
|
|
#
¿
Dec 30, 2015 20:28
|
|
|
The thing is that we could replace a lot of modern conveniences with alternative ones that work just as well - or better. One example - solar heaters. A poo poo but working version can be built from painted aluminum cans, glass, and a box. They work pretty well in a good chunk of the country, providing heat during the day. Problem is that it's an ugly black box on the side of your house, so gently caress that because of social reasons. Our houses suck rear end at retaining heat and cool air, which could be fixed by building them out of things that don't suck. Again, social reasons frequently prevent this. They could even be made virtually weather-proof, but screw it, because of appearances.
|
|
#
¿
Jan 1, 2016 18:24
|
|
|
Verge posted:Show me this weather-proof house. Start reading
|
|
#
¿
Jan 1, 2016 18:29
|
|
|
How much space do you reckon an attic encompasses in a 'normal' house? What about wall thickness or other dead space areas? They started building stemwalls before 2000 as a variation on the pure dome, which accommodate people a bit better - or at least make the structure look more like a 'normal' house.
|
|
#
¿
Jan 1, 2016 19:01
|
|
|
Verge posted:I don't consider the attic in a conventional home as wasted space because it does not extend outward into our land-space but I'd guess...1/4? I mean, all I'm saying is that I don't see the benefit to extending the structure outward. poo poo, a dome roof makes engineering sense, no question, and a dome house if you really need to withstand nature's wrath but outside those factors, I don't see a benefit outside of having wasted horizontal space, unless you're making the claim that they can make the walls significantly thinner. This is all, of course, secondary to the difficulty in the fabrication process (steel beams that don't go straight are a oval office!) This house looks pretty loving rad, using two domes that blend in tremendously well. I think it might be more susceptible to weather, though. Fabrication is a non-issue. They use rebar - either steel or basalt, not beams.
|
|
#
¿
Jan 2, 2016 00:26
|
|
|
lapse posted:New GISS data. As you can see, global warming stopped in 1998 That +1.5�C target out of Paris sure ain't looking good. Also, December GLOBAL 2015 anomaly: Land +3.40�F 1st Warmest Ocean +1.49�F 1st Warmest Land+Ocean +2.00�F 1st Warmest Whee... p.s. in light of this result, rename thread to "tl;dr we're all hosed" like the (accurate) old thread title. Evil_Greven fucked around with this message at 00:31 on Jan 21, 2016 |
|
#
¿
Jan 21, 2016 00:27
|
|

|
December 2015:quote:The December 2015 globally-averaged temperature across land and ocean surfaces was 1.11�C (2.00�F) above the 20th century average of 12.2�C (54.0�F), the highest for any month since records began in 1880, surpassing the previous all-time record set two months ago in October by 0.12�C (0.21�F). This is the first time the global monthly departure from average has surpassed 1�C and is the largest margin by which an all-time monthly temperature record has been broken. Incredibly, the December 2015 temperature also surpasses the December record temperature set last year by 0.29�C (0.52�F), the largest margin by which a monthly temperature record has been broken for its respective month. quote:Separately, the global land surface temperature was 1.89�C (3.40�F) above average, the highest on record for December, surpassing the previous record set in 2006 by 0.48�C (0.86�F). quote:Australia ended 2015 on a warm note, with its sixth highest December temperature in the country's 106-year period of record, at 1.04�C (1.87�F) higher than the 1961�1990 national average. 
|
|
#
¿
Jan 21, 2016 23:52
|
|
|
Annual Report 2015:quote:The State of the Climate November 2015 report noted that in order for 2015 to not become the warmest year in the 136-year period of record, the December global temperature would have to be at least 0.81�C (1.46�F) below the 20th century average�or 0.24�C (0.43�F) colder than the current record low December temperature of 1916. In fact, December 2015 was the warmest month of any month in the period of record, at 1.11�C (2.00�F) higher than the monthly average, breaking the previous all-time record set just two months ago in October 2015 by 0.12�C (0.21�F).  quote:With the contribution of such record warmth at year's end and with 10 months of the year record warm for their respective months, including the last 8 (January was second warmest for January and April was third warmest), the average global temperature across land and ocean surface areas for 2015 was 0.90�C (1.62�F) above the 20th century average of 13.9�C (57.0�F), beating the previous record warmth of 2014 by 0.16�C (0.29�F).  Just to remind everyone how hosed we are: quote:The warmth was due to the near-record strong El Ni�o that developed during the Northern Hemisphere spring in the eastern and central equatorial Pacific Ocean and to large regions of record warm and much warmer-than-average sea surface temperatures in parts of every major ocean basin.
|
|
#
¿
Jan 22, 2016 00:03
|
|
|
Sure... if U.S. dollars have a value in the future hellscape. I'm not convinced that they will.
|
|
#
¿
Jan 22, 2016 01:50
|
|
|
Good news! Things are looking up:
|
|
#
¿
Jan 23, 2016 06:52
|
|
|
Oh, Australia...quote:As many as 110 out of 140 positions at the atmosphere and oceans division at the Commonwealth Scientific and Industrial Research Organisation (CSIRO) will be cut, Larry Marshall, the agency�s chief executive, told staff Friday. Another 120 positions will be cut from the land and water program. Across the agency, 350 climate staff will be moved into new roles unrelated to their specialty.
|
|
#
¿
Feb 9, 2016 01:57
|
|
|
Do you know what September 1979 and January 2016 have in common?
|
|
#
¿
Feb 25, 2016 05:48
|
|
|
The months long uncontrollable methane release in California probably didn't help matters. At least they plugged it this past month, finally. Alas, it is inconsequential... its total output was something like 1/4th of what California alone spews.
|
|
#
¿
Mar 5, 2016 04:57
|
|
|
If all the smarter people don't have kids (presumably dumb people are going to continue doing so), it's going to be loving Idiocracy out in the future.
|
|
#
¿
Mar 31, 2016 04:26
|
|
|
Weather continues to troll Oklahoma.
|
|
#
¿
May 24, 2016 22:59
|
|
|
Things are looking up! https://www.youtube.com/watch?v=06Xc3LtZRWo
|
|
#
¿
Jul 22, 2016 01:00
|
|
|
Perhaps similar to how ice can trap CO2 bubbles given the right conditions? Anyway, I want to remind folks of something kind of important: Photosynthesis doesn't make oxygen out of carbon dioxide. Instead, the emitted oxygen (and plants don't always emit it) comes from the water that is also used during photosynthesis. The oxygen molecules of carbon dioxide make up the sugars that plants produce. That is why you see this: Evil_Greven fucked around with this message at 23:43 on Jul 22, 2016 |
|
#
¿
Jul 22, 2016 23:39
|
|
|
TildeATH posted:What horrible doom does this graph mean? I don't know anything about O2 concentration. Placid Marmot posted:That's pretty pedantic (N.B. I am never pedantic) and NOT important. Uhh... no? This is why it's important - because you just repeated the wrong thing: Photosynthesis does not change CO2 into O2. This is what produces oxygen during photosynthesis: 2H2O → 4 electrons + 4 H protons + O2 CO2 + 4 electrons + 4 H protons → CH2O + H2O There are other processes (Calvin cycle) that eventually creates phosphate or sugars. The important takeaway is that more/faster-growing plants are not going to pump out more oxygen as a result of an increase in CO2. Evil_Greven fucked around with this message at 02:28 on Jul 23, 2016 |
|
#
¿
Jul 23, 2016 02:11
|
|
|
Placid Marmot posted:I understand that, chemically, the O2 comes from H2O, as I acknowledged in my response (though my last line was self-contradictory), but I had not appreciated that this mechanism may be a significant cause of ocean deoxygenation, which I believed to be caused by eutrophication-like phenomena. Here are some fun things to think about when one looks at how O2 is released and how CO2 is captured as outlined above: -Plants get more water-efficient as -Phosphorus depletion on land -Phosphorus accumulation in water (as you hint at here) Evil_Greven fucked around with this message at 03:29 on Jul 23, 2016 |
|
#
¿
Jul 23, 2016 03:25
|
|
|
Whoops:quote:New research led by NASA scientists reveals that almost one-fifth of the global warming that has occurred in the past 150 years has been missed by historical records due to quirks in how global temperatures were recorded. The study explains why projections of future climate based solely on historical records estimate lower rates of warming than predictions from climate models. A lack of Arctic measurements and the attempts to get them seems to be to blame for this: quote:The Arctic is warming faster than the rest of Earth, but there are fewer historic temperature readings from there than from lower latitudes because it is so inaccessible. A data set with fewer Arctic temperature measurements naturally shows less warming than a climate model that fully represents the Arctic. They didn't think these quirks would add up to a big difference, but: quote:These quirks hide around 19 percent of global air-temperature warming since the 1860s. That�s enough that calculations generated from historical records alone were cooler than about 90 percent of the results from the climate models that the Intergovernmental Panel on Climate Change (IPCC) uses for its authoritative assessment reports. In the apples-to-apples comparison, the historical temperature calculation was close to the middle of the range of calculations from the IPCC�s suite of models. quote:Any research that compares modeled and observed long-term temperature records could suffer from the same problems, Richardson said. �Researchers should be clear about how they use temperature records, to make sure that comparisons are fair. It had seemed like real-world data hinted that future global warming would be a bit less than models said. This mostly disappears in a fair comparison.� 
|
|
#
¿
Jul 23, 2016 16:03
|
|
|
Larson C deathwatch.quote:The crack in Larsen C grew around 30 kilometers (18.6 miles) in length between 2011 and 2015. And as it grew, also became wider � by 2015, yawning some 200 meters in length. Since then, growth has only continued � and now, a team of researchers monitoring Larsen C say that with the intense winter polar night over Antarctica coming to an end, they�ve been able to catch of glimpse of what happened to the crack during the time when it could not be observed by satellite.  but ice in Antarctica is increasing! but ice in Antarctica is increasing!
|
|
#
¿
Aug 23, 2016 04:18
|
|
|
Oh, I forgot, the Crystal Serenity is sailing the Northwest Passage right now. This is a 820ft long cruise ship with a 25ft draft. Here's their current progress - Ulukhaktok, on the west coast of Victoria Island as of this post. They haven't shown much in the way of sea ice along the way. They plan to arrive in New York City by September 12th and left Seward, Alaska on August 16th, so they're a good ways along already. Looks like the south route is pretty clear this year, too. Evil_Greven fucked around with this message at 04:02 on Aug 28, 2016 |
|
#
¿
Aug 28, 2016 03:55
|
|
|
The Crystal Serenity is basically free and clear at this point, short of running into an iceberg between Baffin Bay and the NYC. There were some serious storms in August that greatly fractured arctic sea ice, which leads to the potential that literally the north pole might be open water. Somewhat sadly, we can't see it because NOAA didn't have funding to setup a webcam. This isn't reflected on NSIDC for whatever reason, I guess they might still count those scattered bits of ice as enough. However, since storms scattered ice around quite a lot, it seems likely that large portions of the fractured sea ice could melt before the end of the season in the next few weeks of the melt season. Evil_Greven fucked around with this message at 14:43 on Sep 2, 2016 |
|
#
¿
Sep 2, 2016 14:37
|
|
|
The Crystal Serenity is now south of Greenland, having completed a transit of the Northwest Passage. This voyage had escort(s), but to my knowledge didn't need any icebreaker work to transit. The previously mentioned storms in August that greatly fractured arctic sea ice had predictably led to a rapid melt, but there have been some ice gains elsewhere. NSIDC: quote:With about two weeks of seasonal melt yet to go, it is unlikely that a new record low will be reached. However, since August 26, total sea ice extent is already lower than at the same time in 2007 and is currently tracking as the second lowest daily extent on record. In addition, during the first five days of September the ice cover has retreated an additional 288,000 square kilometers (111,000 square miles) as the tongue of sea ice in the Chukchi Sea has started to disintegrate.
|
|
#
¿
Sep 10, 2016 21:11
|
|
|
La Ni�a appears dead this winter - neutral winter is going to suck for a lot of places that had hopes for precipitation. Also I guess the blob is back: https://twitter.com/EricBlake12/status/775031461967650816 Which is um... interesting to say the least. Evil_Greven fucked around with this message at 04:19 on Sep 12, 2016 |
|
#
¿
Sep 12, 2016 04:17
|
|
|
On perhaps a good note, it appears that the melt season might well have ended in the arctic. Sea ice seems to be forming more than it's melting, but a lot of multiyear ice looks to have melted or could still melt due to its location.
|
|
#
¿
Sep 13, 2016 23:21
|
|
|
NewForumSoftware posted:Just because you're incapable of understanding that there is nothing we can do at this point. It occurs to me that this would be a fabulous segment to interleave footage of the real life effects (famine, refugee migrations, etc), but I haven't the time or skills necessary.
|
|
#
¿
Oct 18, 2016 01:12
|
|
|
Well, if someone could figure out how to refine aluminum without taking a shitton of energy, that could drop it from being 5% or so of the entire U.S. electrical consumption. Little things like that would help. So far, no dice, though.
|
|
#
¿
Oct 18, 2016 02:33
|
|
|
Uncle Jam posted:The temperature of the great lakes is actually increasing in November. Remember, more snow means it's secretly cooling.
|
|
#
¿
Nov 10, 2016 00:53
|
|

|
Well, the literal and absolute worst-case scenario projected an ice-free Arctic at the end of the summer melt season by 2016. Guess that was a year or two ahead. Take that you SCIENTISTS! You were wrong again! e: From this cool place a few days ago: quote:We are some 500k km2+ below the record low and over 1mln km2 below 2007 for Nov 9. quote:The chart below shows the mean temperature anomaly for these 19 stations in each October since 1971. Remarkably, the 19-station mean temperature in October 2016 was 5.6�C above the 1981-2010 normal and more than 2�C above the 2012 record. October 2016 was the second most anomalous calendar month in the data since 1971 - only January 2016 was warmer relative to normal, at +6.5�C.
Evil_Greven fucked around with this message at 04:31 on Nov 14, 2016 |
|
#
¿
Nov 14, 2016 04:15
|
|
|
It's likely much too late for preventive measures, really. The only question has been how long before things tip... some thought it was going to take a lot longer to reach such a point; could be that we passed it already. I'm sure President Trump will save us. Continued: quote:Looking at recent daily temperature anomalies for the same 19 stations, it is amazing to see that the warmth has become even more pronounced since the end of October; the 19-station mean anomaly reached +9.6�C last Thursday (November 3), and on Friday the coolest of the stations was 5.4�C warmer than normal. In terms of standard deviations, Thursday's mean anomaly was the highest of any day from 1971-present. Evil_Greven fucked around with this message at 04:41 on Nov 14, 2016 |
|
#
¿
Nov 14, 2016 04:33
|
|
|
That and Republicans' successful delay of the SCOTUS nomination gives it to ... Donald Trump to decide. Great work.
|
|
#
¿
Nov 15, 2016 03:02
|
|
|
So the North Pole might have been at or above freezing today. You know, just to contribute to all of the good news. Central Oklahoma hasn't even had a loving freeze yet. It's halfway through NOVEMBER, and the closest possibility until December ?? is the end of this week. Usually it's in mid-late October. e: I know I know, weather and all - and Oklahoma is especially schizophrenic - but it was in the 80s today. Aren't there wildfires and poo poo out East? Evil_Greven fucked around with this message at 01:43 on Nov 16, 2016 |
|
#
¿
Nov 16, 2016 01:29
|
|
|
Yeah. It's odd that it has been more mild overall here... less cold and hot weather.yellowyams posted:Couldn't anyone make a big news story out of this? I haven't seen any of the climate change groups making much of an effort to spread info on what's going on with the Arctic right now. The only reason I even know is because of this thread. I made note of it here. It seemed to have been met with a collective meh overall.
|
|
#
¿
Nov 16, 2016 01:46
|
|
|

|
| # ¿ Apr 29, 2024 07:47 |
|
|
Oh yeah, it's been awhile since one of these was posted: https://twitter.com/ahaveland/status/798184605748600834 e: Note that this doesn't have November 2016, which is the current concern; 2016 is below all previous November measurements. Evil_Greven fucked around with this message at 03:30 on Nov 16, 2016 |
|
#
¿
Nov 16, 2016 03:25
|
|